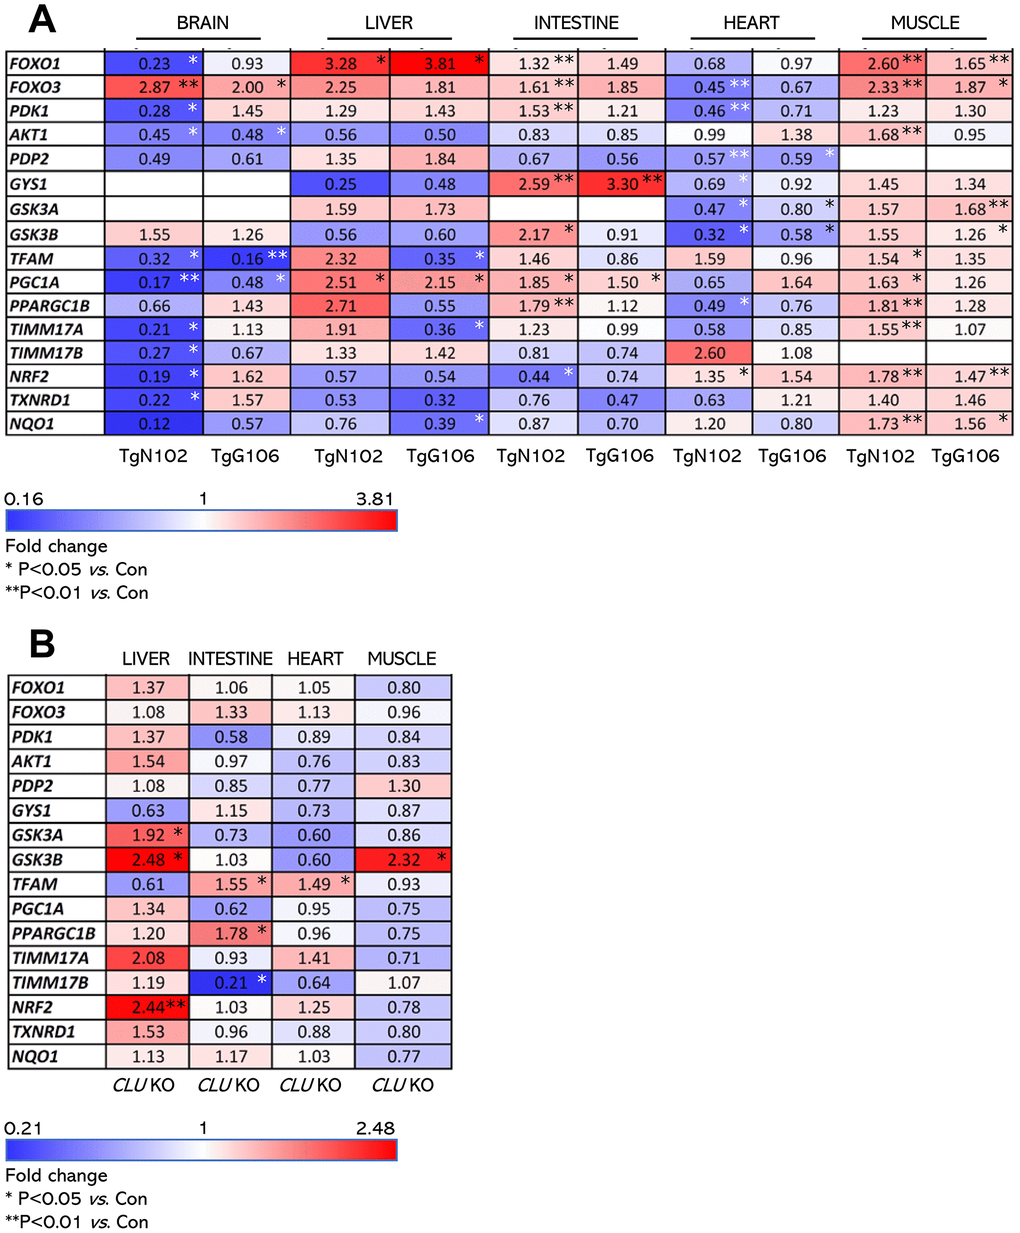
Figure 2.Expression levels (vs. controls) of antioxidant, mitochondrial and metabolic genes (heat map) in isolated shown tissues of TgN102 and TgG106 (ubiquitous CLU OE) mice or in CLU KO mice. (A) Heat map indicating relative expression levels of shown genes in isolated brain, liver, intestine, heart, and muscle tissues of TgN102 and TgG106 (ubiquitous CLU OE) vs. control (Con; littermate non-Tg) mice. (B) Heat map of shown genes expression in isolated liver, intestine, heart, and muscle tissues of CLU KO vs. control mice. *P<0.05; **P<0.01 (Tg or KO mice vs. Con); additional statistical analyses (i.e., Pearson Correlation r and F significance) are shown in Supplementary Tables 1, 2.
Figure 2 — Clusterin overexpression in mice exacerbates diabetic phenotypes but suppresses tumor progression in a mouse melanoma model | Aging