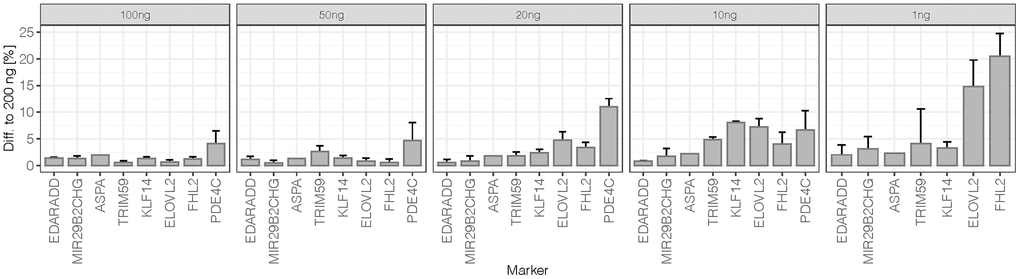
Figure 3.Difference to 200 ng of sensitivity dilutions at 50% methylation level: The average difference per marker was calculated from mean obtained methylation values (N = 2) at all 44 target CpG sites. The error bars represent the standard deviation at markers targeting more than one CpG (EDARDD 2 CpGs, ELOVL2 9 CpGs, FHL2 10 CpGs, KLF14 4 CpGs, MIR29B2CHG 3 CpGs, PDE4C 7 CpGs, TRIM59 8 CpGs). Due to the high difference of PDE4C at 1 ng (61.9%), the value is excluded from the plot.