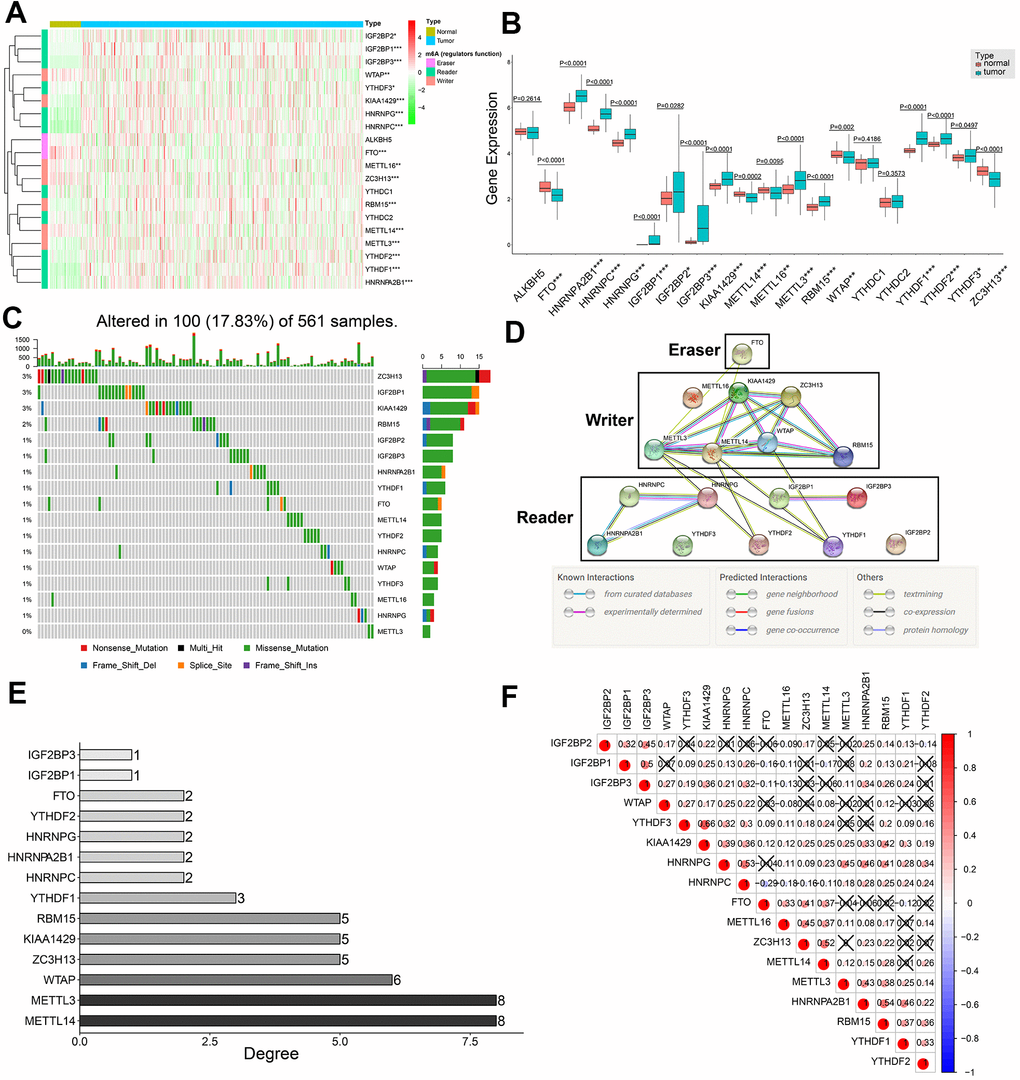
Figure 1.Expression patterns of twenty m6A regulatory genes in LDAC tissues and protein-protein interaction network analysis of m6A regulatory genes. (A) Heat map shows expression levels of 20 m6A regulatory genes in 59 normal lung and 535 LADC tissues. Note: *0.01 ≤ P < 0.05, **0.001 ≤ P < 0.01, ***P < 0.001. (B) Boxplot shows differential expression of the 20 m6A regulatory genes in LADC tissues compared to normal lung tissues. Note: *0.01 ≤ P < 0.05, **0.001 ≤ P < 0.01, ***P < 0.001. (C) Single nucleotide variations in seventeen m6A regulatory genes based on analysis of 561 LADC patient tissues. (D) PPI network analysis of seventeen m6A regulatory genes using STRING database. (E) The interacting numbers of each gene with the other sixteen genes. If the value of one gene is equal to 1, it means that only one of the other sixteen genes was interacted with this gene. (F) Spearman correlation analysis between 17 m6A regulatory genes. Blue indicates negative correlation in comparison with red indicating positive correlation. All the correlation coefficients are shown in the squares, and the areas of circles in the squares are positive correlated with the absolute value of corresponding correlation coefficients. Squares containing crosses denotes the P-values of correlation analyses are above 0.05.