Submit an Article
Navigate
Home
Editorial Board
Editorial Policies
Current Volume
Archive
Scientific Integrity
Publication Ethics Statements
Interviews with Outstanding Authors
Newsroom
Sponsored Conferences
Podcast
Contact
Special Collections
Submit an Article
Online ISSN: 1945-4589
Research Paper
|
Volume 13, Issue 6
|
pp. 9056–9070
Transplantation of olfactory ensheathing cells promotes the therapeutic effect of neural stem cells on spinal cord injury by inhibiting necrioptosis
Back to article
Figure 5
(5 of 8)
−
100%
+
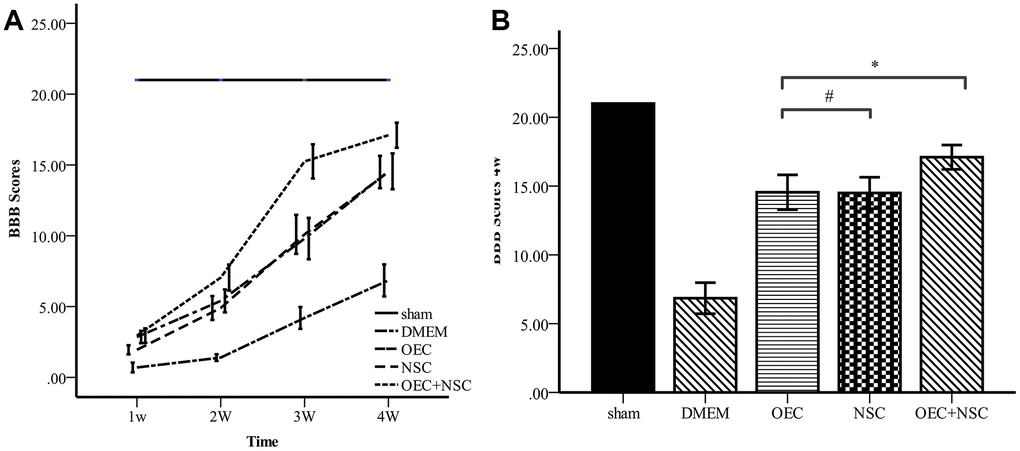
Figure 5.
Comparison of BBB scores.
(
A
) BBB scores for each group varied over time. Error bar: 95% CI. (
B
) BBB scores at four weeks after cell transplantations. (mean ± SEM; two-way ANOVA,
post-hoc
test: Dunn-Bonferroni; error bar: 95% CI; **P<0.01).