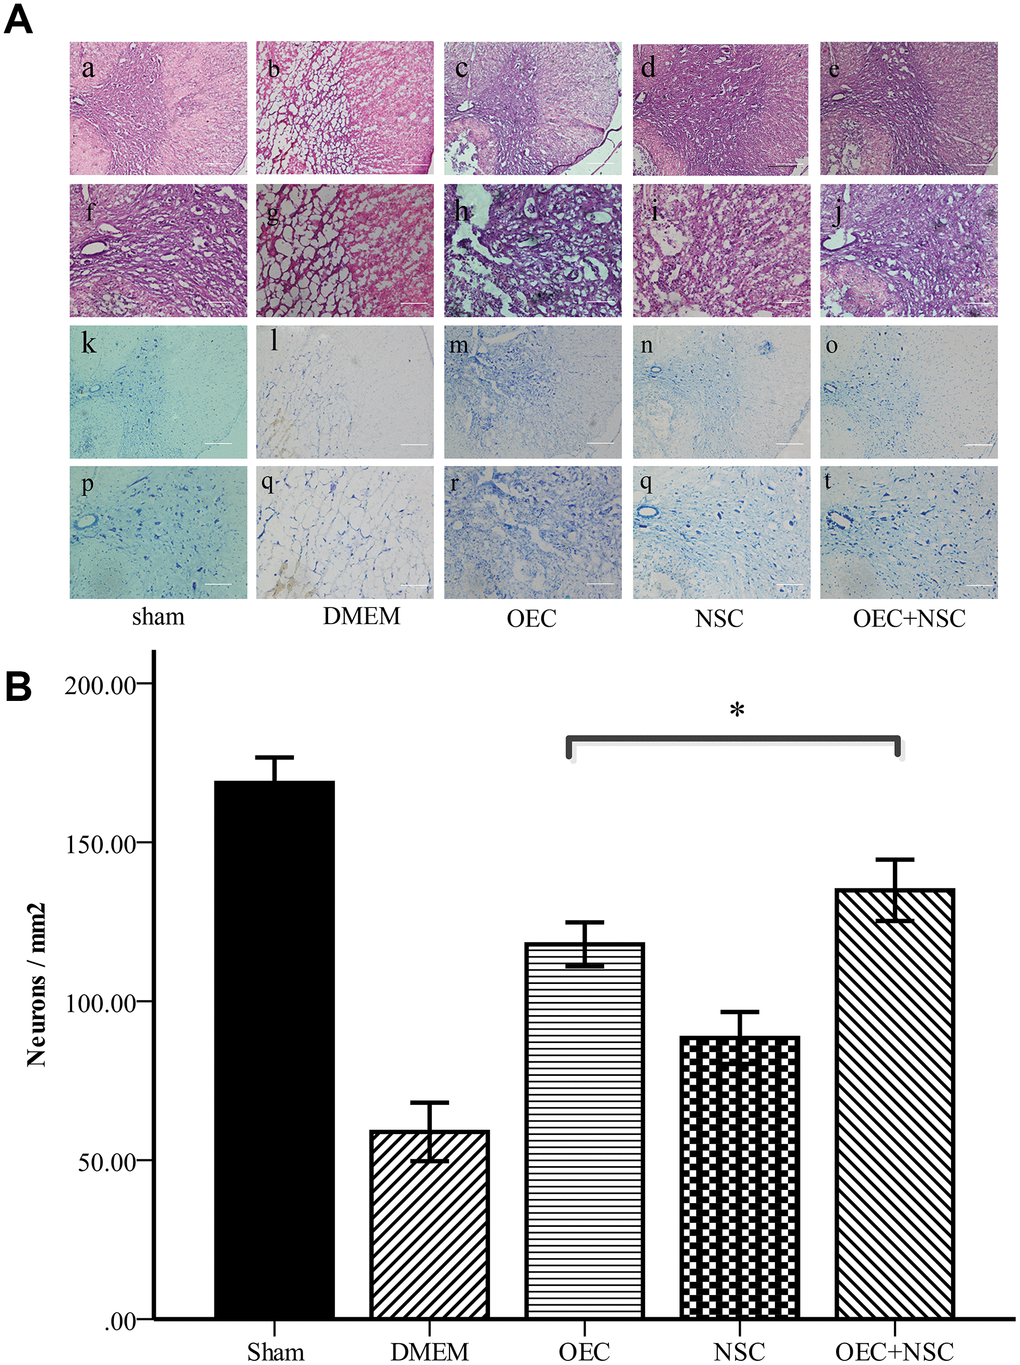
Figure 4.(A) Morphological changes at one week after SCI. (a–j) HE staining in each group. Scale bars: a–c 100 μm, f–j 50 μm. (k–t) Nissl staining in each group. Scale bars: k–o 100 μm, p–t 50 μm; (B) Quantitative analysis showed that the number of neurons in the OEC+NSC group was significantly increased in comparison with that in the DMEM group or NSC group. (mean ± SEM; one-way ANOVA, post-hoc test: Dunn-Bonferroni; error bar: 95% CI; *P<0.05, pairwise comparisons of other groups: P < 0.01).