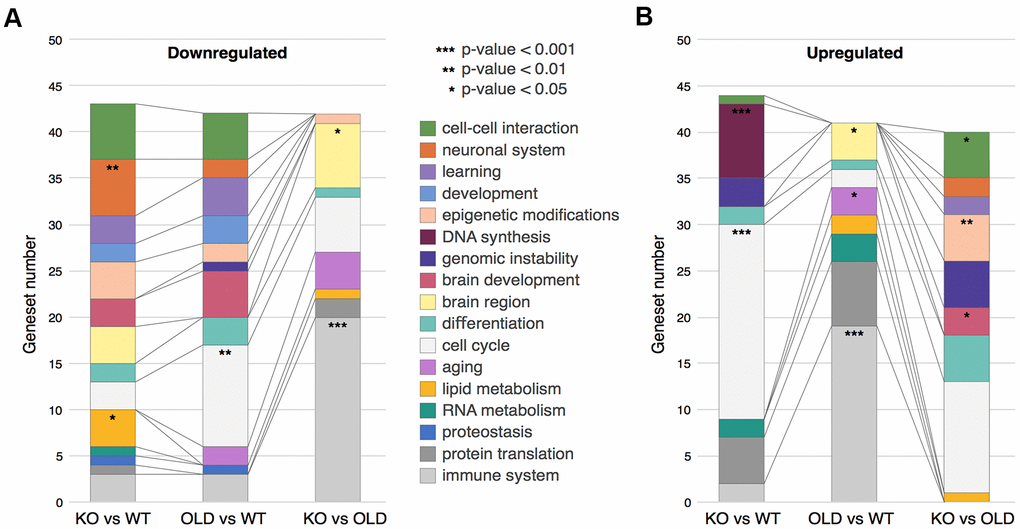
Figure 2.Clustering of GSEA categories. (A) Downregulated clusters of GSEA categories in the different comparisons. (B) Upregulated clusters of GSEA categories in the different comparisons. In both panels, colors correspond to clusters of GSEA categories, while stars represent hypergeometric test p-values: * - p-value < 0.05, ** - p-value < 0.01, *** - p-value < 0.001.