Submit an Article
Navigate
Home
Editorial Board
Editorial Policies
Current Volume
Archive
Scientific Integrity
Publication Ethics Statements
Interviews with Outstanding Authors
Newsroom
Sponsored Conferences
Podcast
Contact
Special Collections
Submit an Article
Online ISSN: 1945-4589
Research Paper
|
Volume 13, Issue 6
|
pp. 9011–9027
Functional genomics study of protein inhibitor of activated STAT1 in mouse hippocampal neuronal cells revealed by RNA sequencing
Back to article
Figure 6
(6 of 8)
−
100%
+
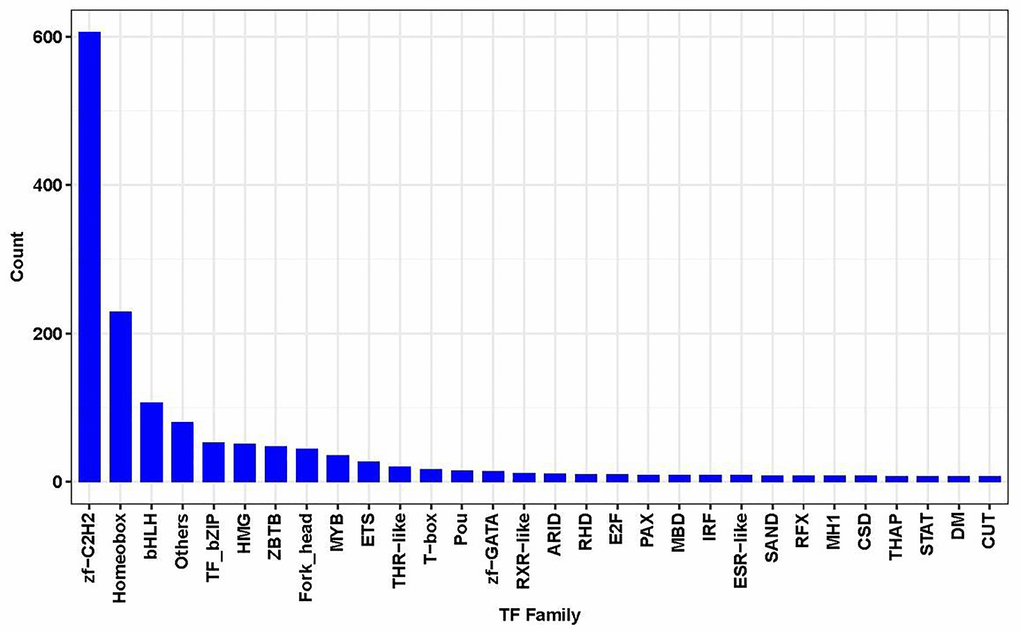
Figure 6.
Results of TF family gene counts.
This chart showed the top significantly enriched TF family (X-axis) with the gene count (Y-axis).