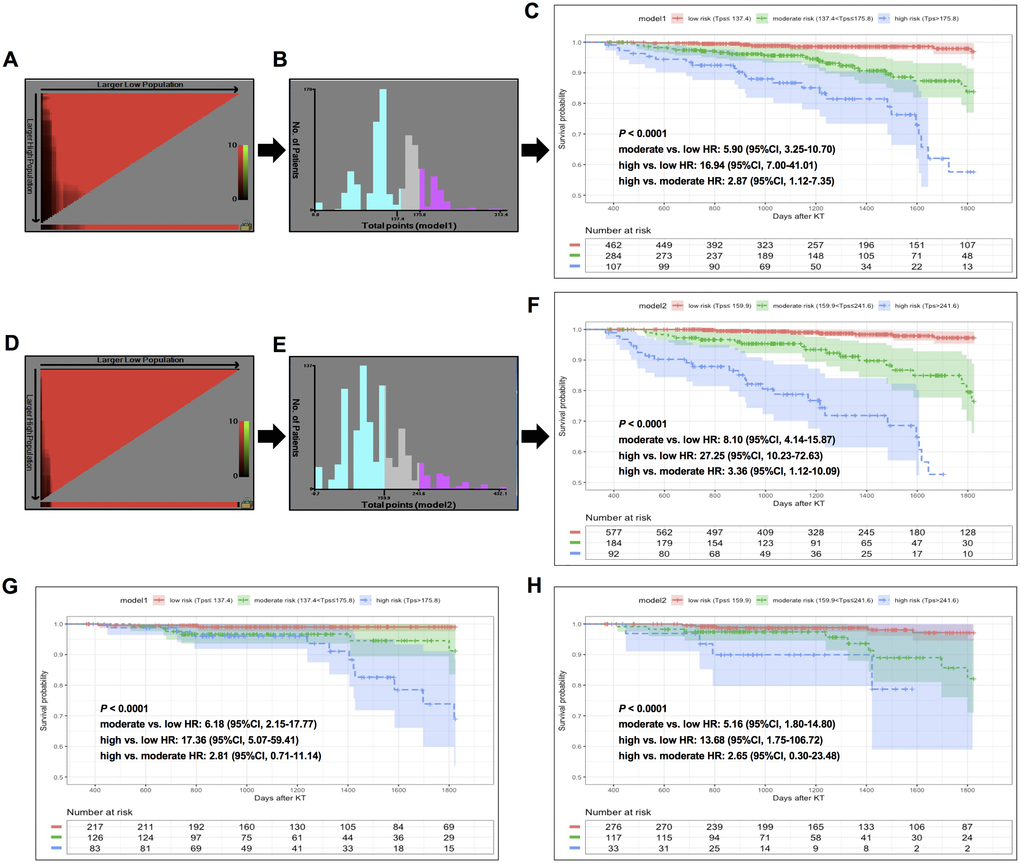
Figure 5.X-tile analysis of total risk score and survival curves stratified by the score calculated from nomogram scoring systems in training and validation sets. In training set: (A–B) X-tile plot and total points histogram showing the optimal cut-points of model 1. (C) Kaplan-Meier (KM) survival curve of different risk groups based on cut-points obtained from model 1 X-tile analysis. (D–E) X-tile plot and total points histogram showing the optimal cut-points of model 2. (F) KM survival curve of different risk groups based on cut-points obtained from model 2 X-tile analysis. In validation set: (G–H). KM survival curves of KTRs stratified by optimal cut-points from model 1 (G) and model 2 (H).