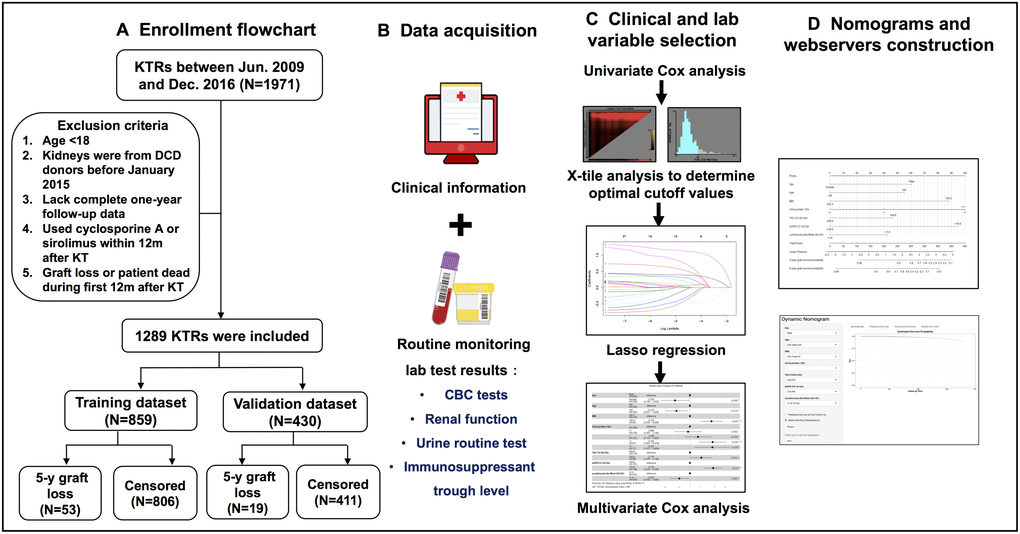
Figure 1.Flow diagram of developing predictive nomograms for 5-year graft survival in KTRs. (A) Patients enrollment flowchart. (B) Candidate predictor and outcome data acquisition. (C) Predictor selection process. (D) Nomogram and web server construction.