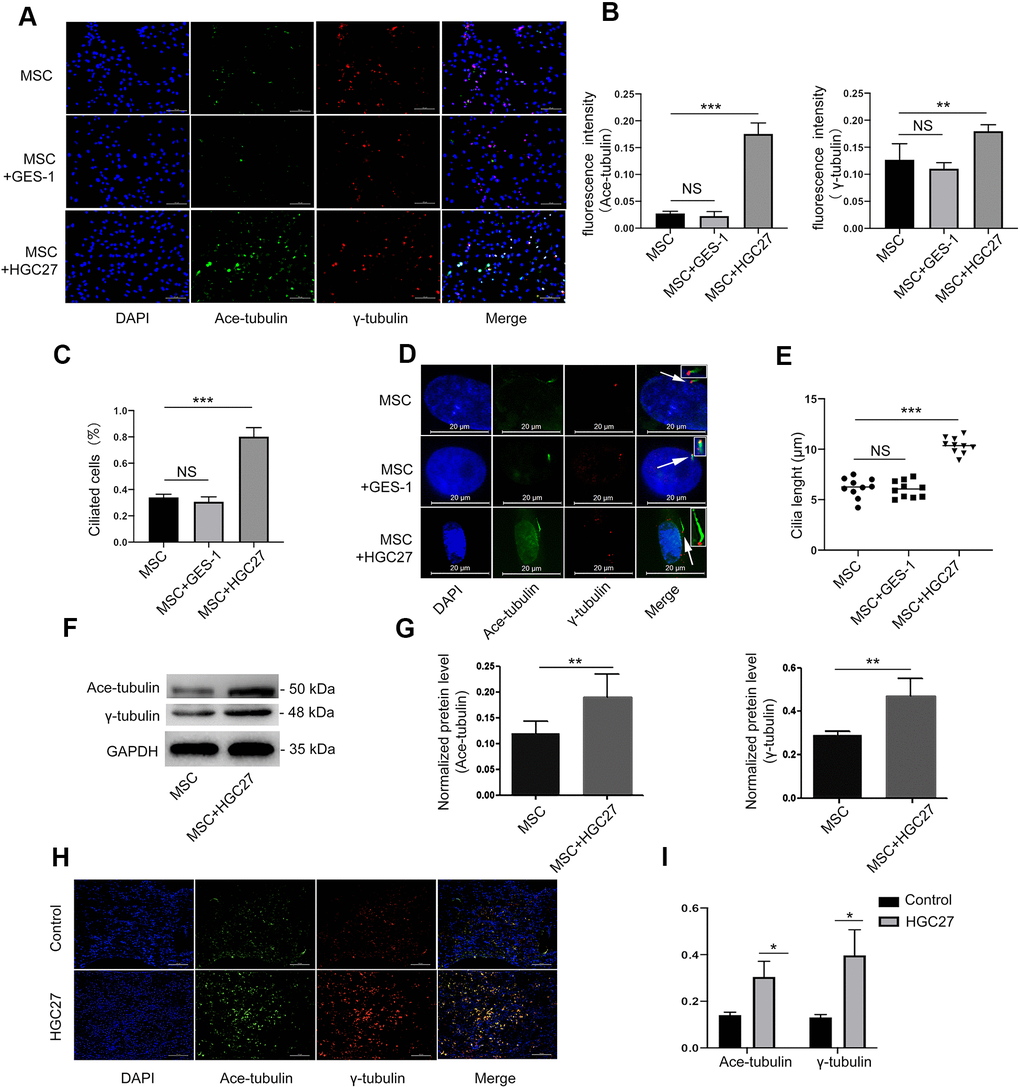
Figure 4.HGC27 but not the GES-1 increased the cilia formation of MSCs. (A) Immunofluorescence analysis of primary cilia in MSC, MSC+GES-1, MSC+HGC27. Primary cilia were stained with acetylated α-tubulin (axoneme, green) and γ-tubulin (basal body, red) antibody. Scale bars, 100 μm. (B) Quantitative analysis of the fluorescence intensity of immunofluorescence in (A). (C) Quantitative evaluated the number of cilia on an equal area (n=3, at least 200 cells). (D) Representative images of primary cilia in MSCs. The inset shows a high-power image of the basal body and axoneme. Primary cilia are stained with acetylated α-tubulin (axoneme, green) and γ-tubulin (basal body, red) antibodies. DAPI staining is used as nuclear counterstaining (blue). Scale bars, 20 μm. (E) Graphical representation of cilia length in the MSC, MSC+GES-1, and MSC+HGC27 groups (n=10). (F) Western blot analysis of acetylated α-tubulin and γ-tubulin expression in MSCs with or without co-cultured HGC27. (G) Quantitative analysis of acetylated α-tubulin and γ-tubulin protein levels from immunoblots in (F). Acetylated α-tubulin and γ-tubulin protein levels were normalized to GAPDH (n=3). (H) Femur tissues of C57BL mice injected with PBS or HGC27 cells at 90 days post-injection are stained for γ-tubulin (red), acetylated α-tubulin (green), and nuclei (blue). Scale bar, 100 μm. (I) Quantitative analysis of the fluorescence intensity in (H). Data are shown as mean±SEM. Statistical differences were obtained using Student's t-test, *, p<0.05, **, p<0.01, ***p<0.001.