Submit an Article
Navigate
Home
Editorial Board
Editorial Policies
Current Volume
Archive
Scientific Integrity
Publication Ethics Statements
Interviews with Outstanding Authors
Newsroom
Sponsored Conferences
Podcast
Contact
Special Collections
Submit an Article
Online ISSN: 1945-4589
Research Paper
|
Volume 13, Issue 5
|
pp. 6554–6564
A prognostic model for melanoma patients on the basis of immune-related lncRNAs
Back to article
Figure 5
(5 of 5)
−
100%
+
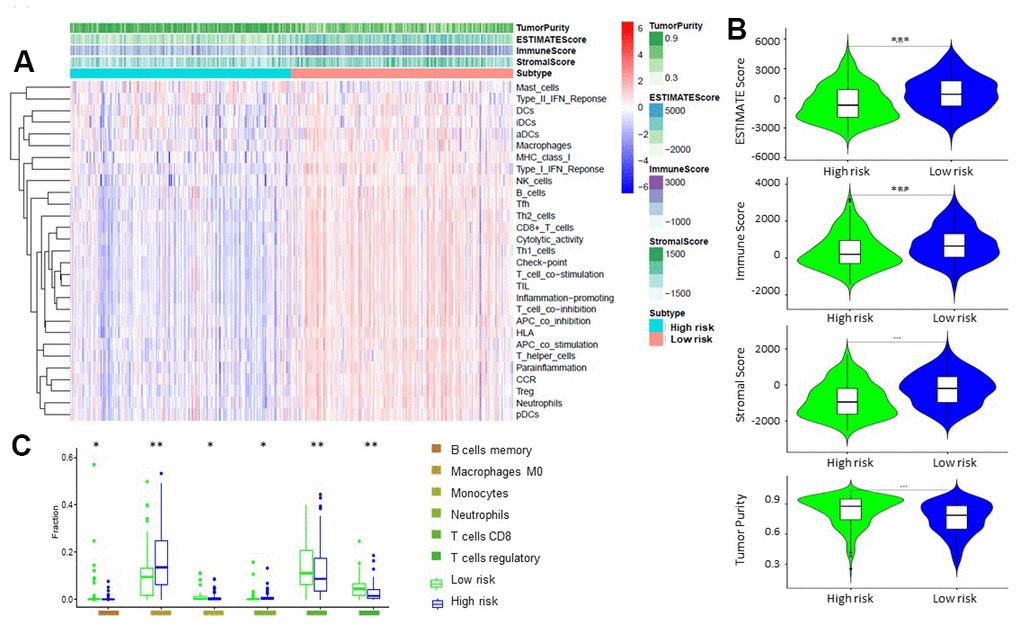
Figure 5.
Comparison of ESTIMATE between high-risk and low-risk groups.
(
A
,
B
) Tumor purity, stromal score, and immune score of different groups were evaluated by ESTIMATE. (
C
). Comparison of TIICs levels between two groups (ANOVA test).