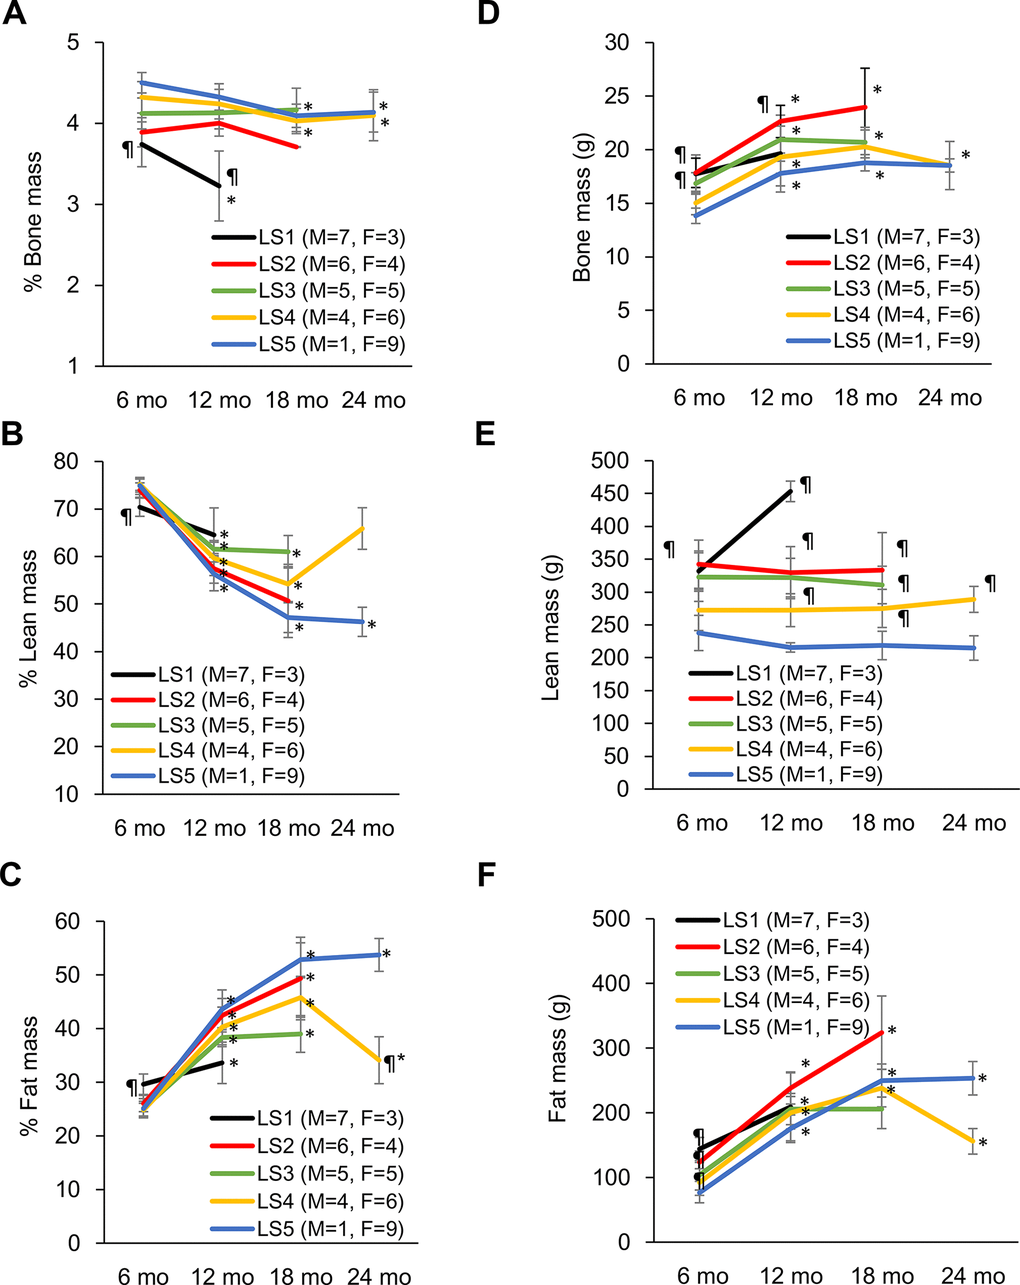
Figure 2.Development of disparity in muscle, bone, and fat percentage of short-lived and long-lived rats during aging. Long-lived rats (LS4 and LS5) are characterized by relatively higher % bone mass from 6 to 24 months of age (A). Short-lived rats had lowest % muscle mass (B) and highest % fat mass (C) at 6 months of age, whereas long-lived survivors showed progressive declines in % muscle mass and increases in % fat mass with age. Absolute bone mass (D), lean mass (E), and fat mass (F) are shown on the right side. Abbreviation: LS, lifespan; LS1 (short-lived, survival time < 579 days); LS2 (survival time 582-672 days); LS3 (survival time 672-738 days); LS4 (survival time 738-870 days); LS5 (long-lived, survival time 870-1032 days). ¶ Significant difference against long-lived rats (LS5), P < 0.05; * Significant difference against 6th month, P < 0.05.