Submit an Article
Navigate
Home
Editorial Board
Editorial Policies
Current Volume
Archive
Scientific Integrity
Publication Ethics Statements
Interviews with Outstanding Authors
Newsroom
Sponsored Conferences
Podcast
Contact
Special Collections
Submit an Article
Online ISSN: 1945-4589
Research Paper
|
Volume 13, Issue 7
|
pp. 9693–9703
Diagnostic values of peripheral blood T-cell spot of tuberculosis assay (T-SPOT.TB) and magnetic resonance imaging for osteoarticular tuberculosis: a case-control study
Back to article
Figure 1
(1 of 3)
−
100%
+
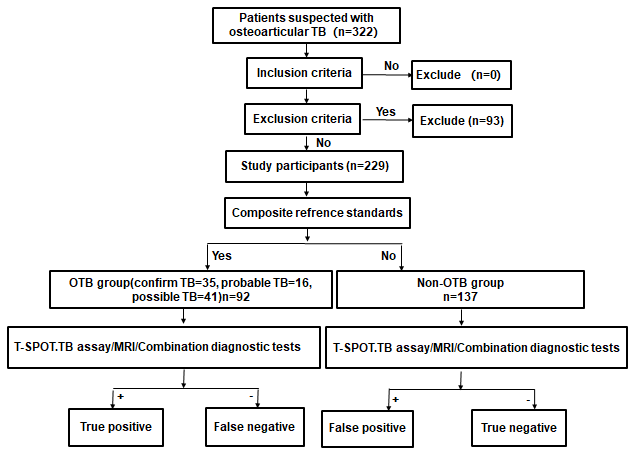
Figure 1.
Study flowchart.
Figure 1 — Diagnostic values of peripheral blood T-cell spot of tuberculosis assay (T-SPOT.TB) and magnetic resonance imaging for osteoarticular tuberculosis: a case-control study | Aging