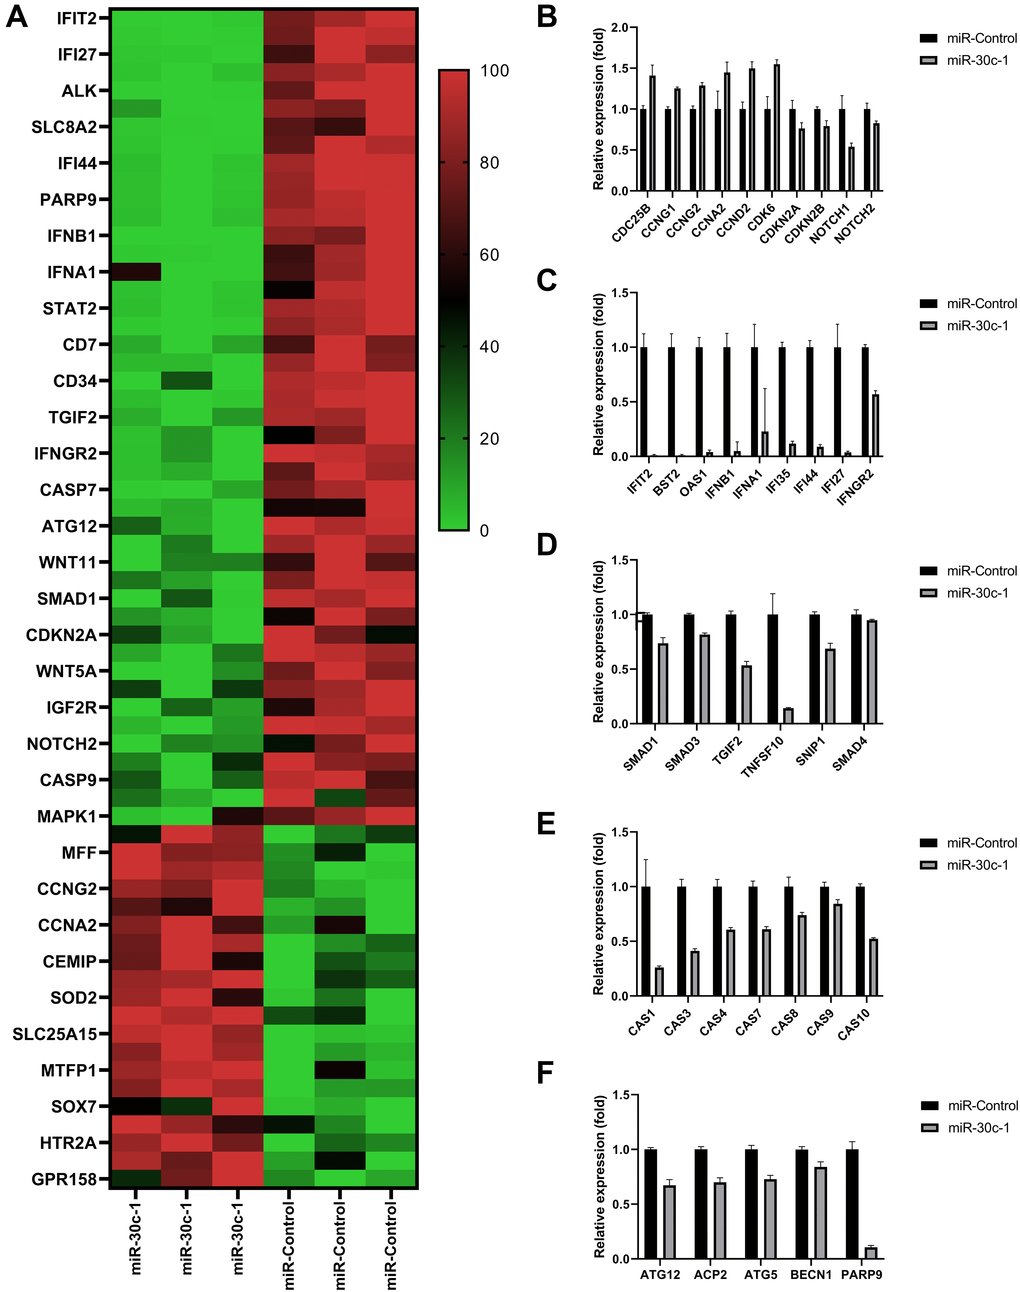
Figure 2.Results of RNA-sequencing data. (A) Heat map of the relative expression of differentially expressed genes. Comparison of relative expressions of proliferation-associated genes (B), interferon (IFN)-associated genes (C), transforming growth factor (TGF; (D)) caspases (E) and autophagy (F) between miR-control group and miR-30c-1 group. *statistically significant.