Submit an Article
Navigate
Home
Editorial Board
Editorial Policies
Current Volume
Archive
Scientific Integrity
Publication Ethics Statements
Interviews with Outstanding Authors
Newsroom
Sponsored Conferences
Podcast
Contact
Special Collections
Submit an Article
Online ISSN: 1945-4589
Research Paper
|
Volume 13, Issue 7
|
pp. 9679–9692
Expression and molecular profiles of the AlkB family in ovarian serous carcinoma
Back to article
Figure 4
(4 of 9)
−
100%
+
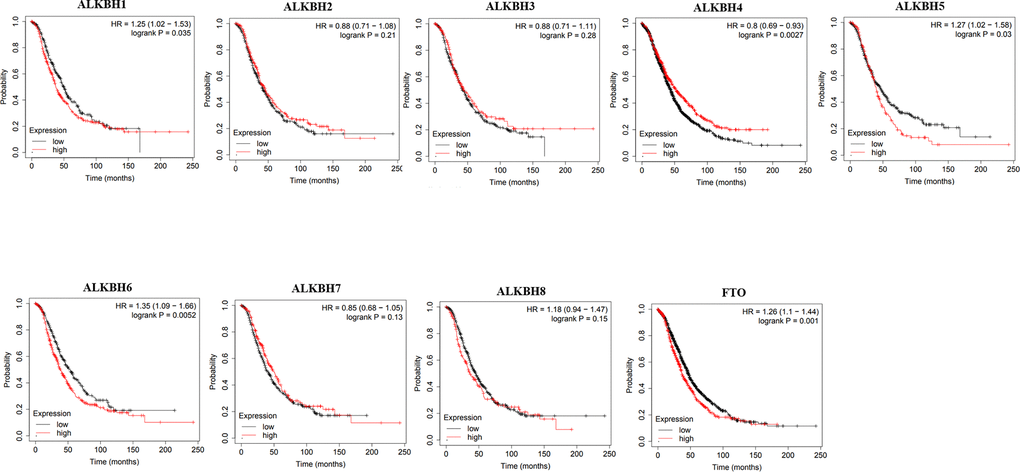
Figure 4.
The correlations of AlkB family expression with patients’ OS.
These OS survival curves were collected from Kaplan-Meier plotter.