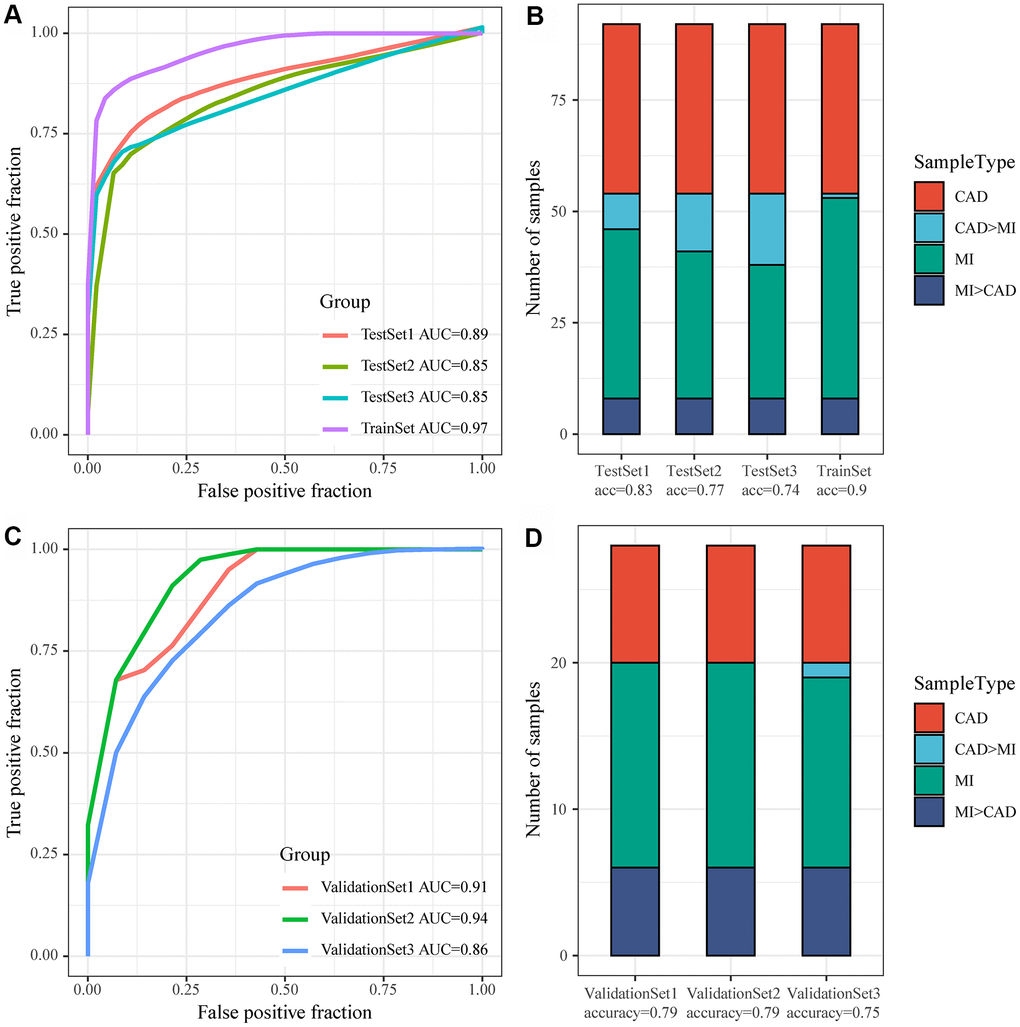
Figure 7.Construction of the MI diagnostic model and testing of the model. (A) ROC curve of the diagnostic model for classification of samples in the training dataset and internal validation dataset; (B) Classification accuracy of the diagnostic model on samples in the training set and in the internal validation set; (C) ROC curve of the diagnostic model for classification of samples in the validation dataset; (D) Classification accuracy of the diagnostic model on samples in the training set and in the validation dataset.