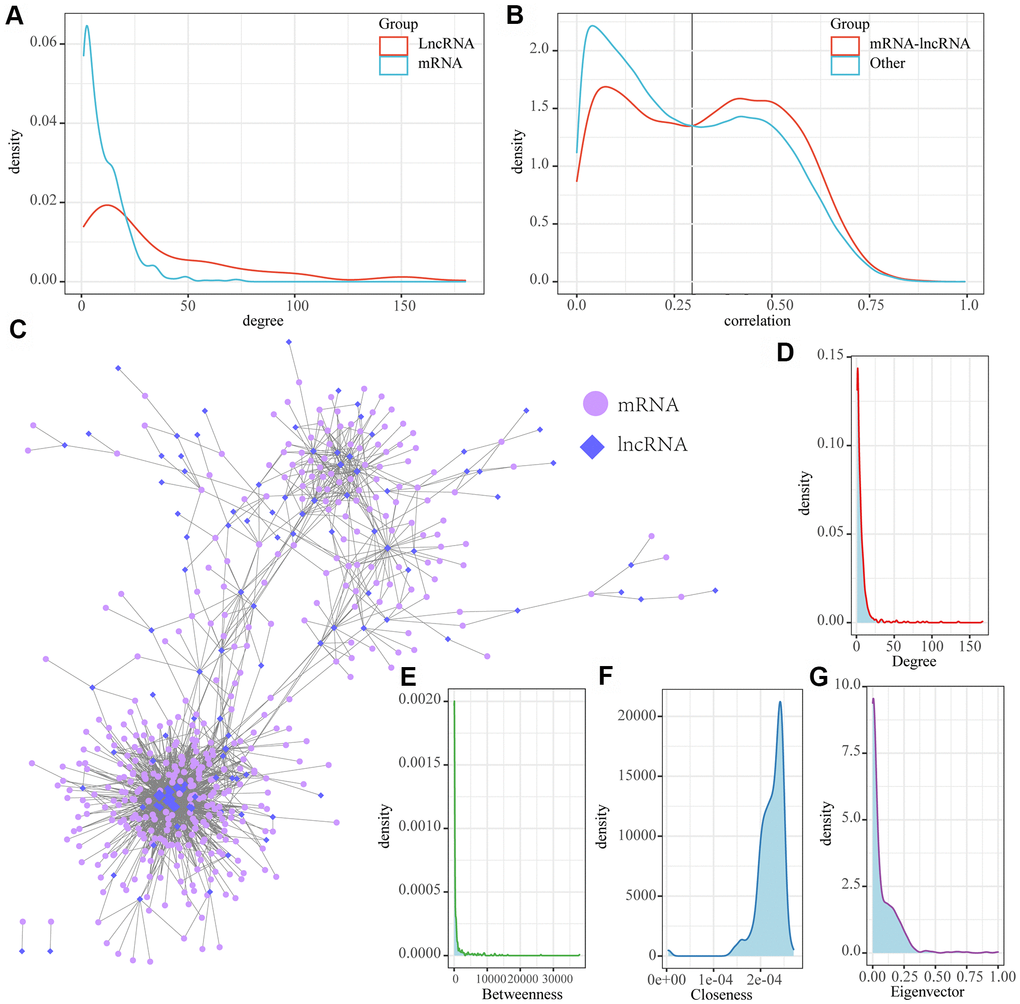
Figure 4.MI-associated LncRNA-mRNA regulatory networks. (A) Distribution degree of lncRNA and mRNA nodes in lncRNA-mRNA interaction networks; (B) Distribution of lncRNA and mRNA correlations in LncRNA-mRNA regulatory networks and lncRNA-mRNA correlations in non-lncRNA-mRNA networks; (C) MI-associated lncRNA-mRNA regulatory networks. (D) Distribution degree of the network. (E) Median centrality distribution of the network. (F) The near-central distribution of the network. (G) The eigenvector centrality distribution of the network.