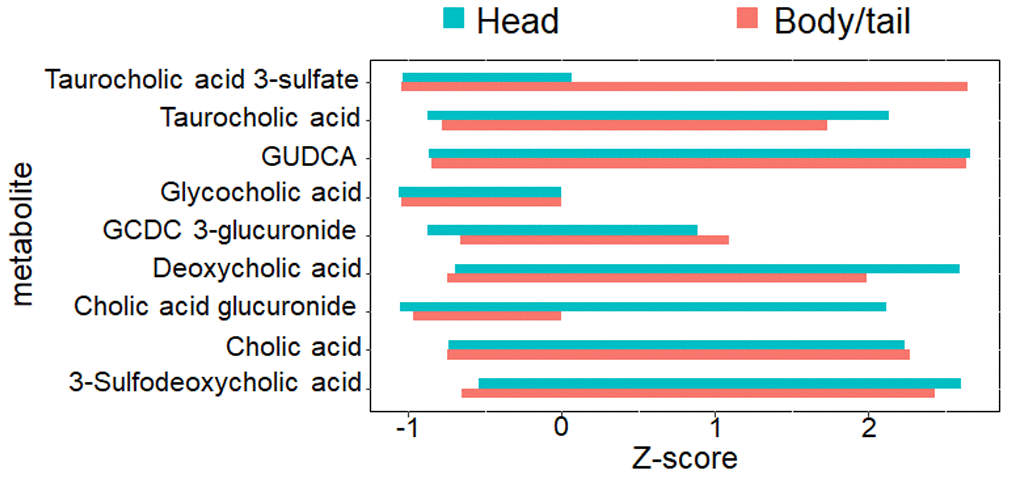
Figure 6.The nine metabolites level involved with bile acid metabolism. The bar chart denoted the direct comparison for the nine bile acid metabolites between pancreatic head and body/neck cancer (n=30 for each group). The Z-score with log transformation was presented. GUDCA, glycoursodeoxycholic acid, GCDC, glycochenodeoxycholic acid.