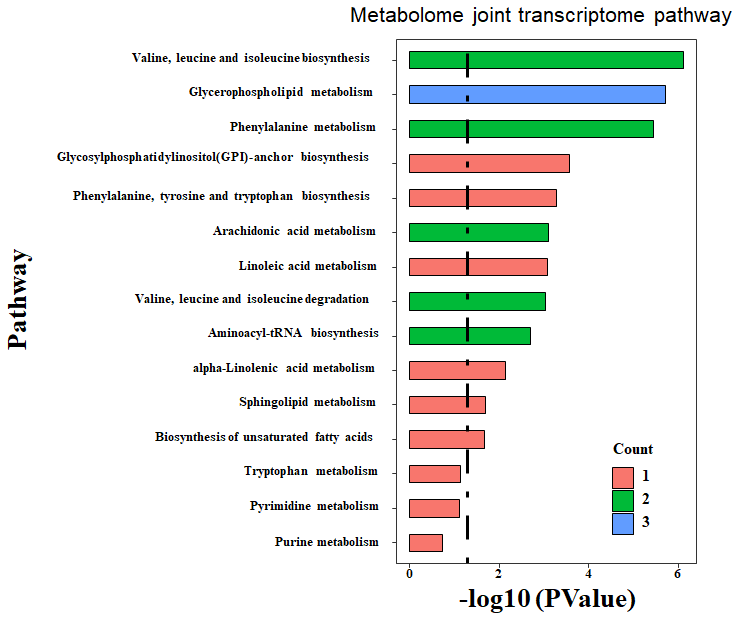
Figure 4.Enriched pathway by integrated analysis. Both the DEM and DEG were submitted to MetaboAnalyst, an online joint analysis module for integrated analysis. The count number is matched number of metabolites from the DEM with the pathway library. The more count number, the more reliable of the enriched pathway. The p-value is the statistical value from the over-representation analysis. The dashed line indicated the significant threshold p-value of 0.05.