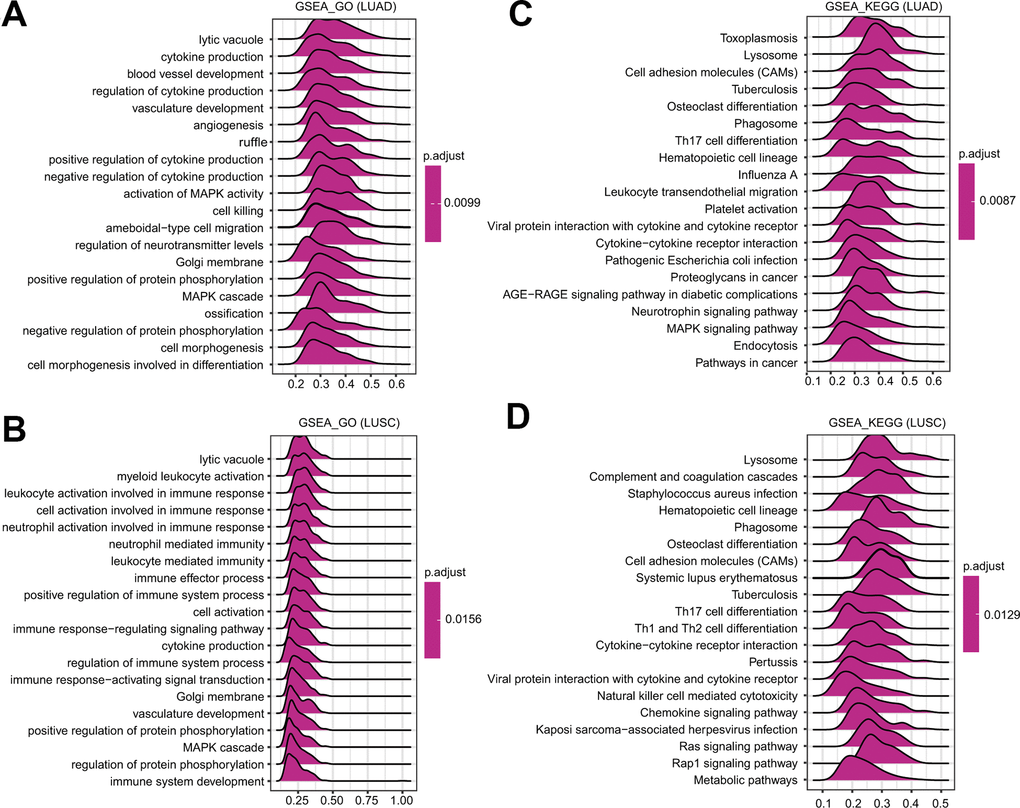
Figure 7.GSEA of FPN1 in lung cancer. (A, B) Merged plots were constructed to exhibit the enriched pathways correlated with FPN1 in LUAD according to GO and KEGG analyses. (C, D) Merged plots were constructed to exhibit the enriched pathways correlated with FPN1 in LUSC according to GO and KEGG analyses.