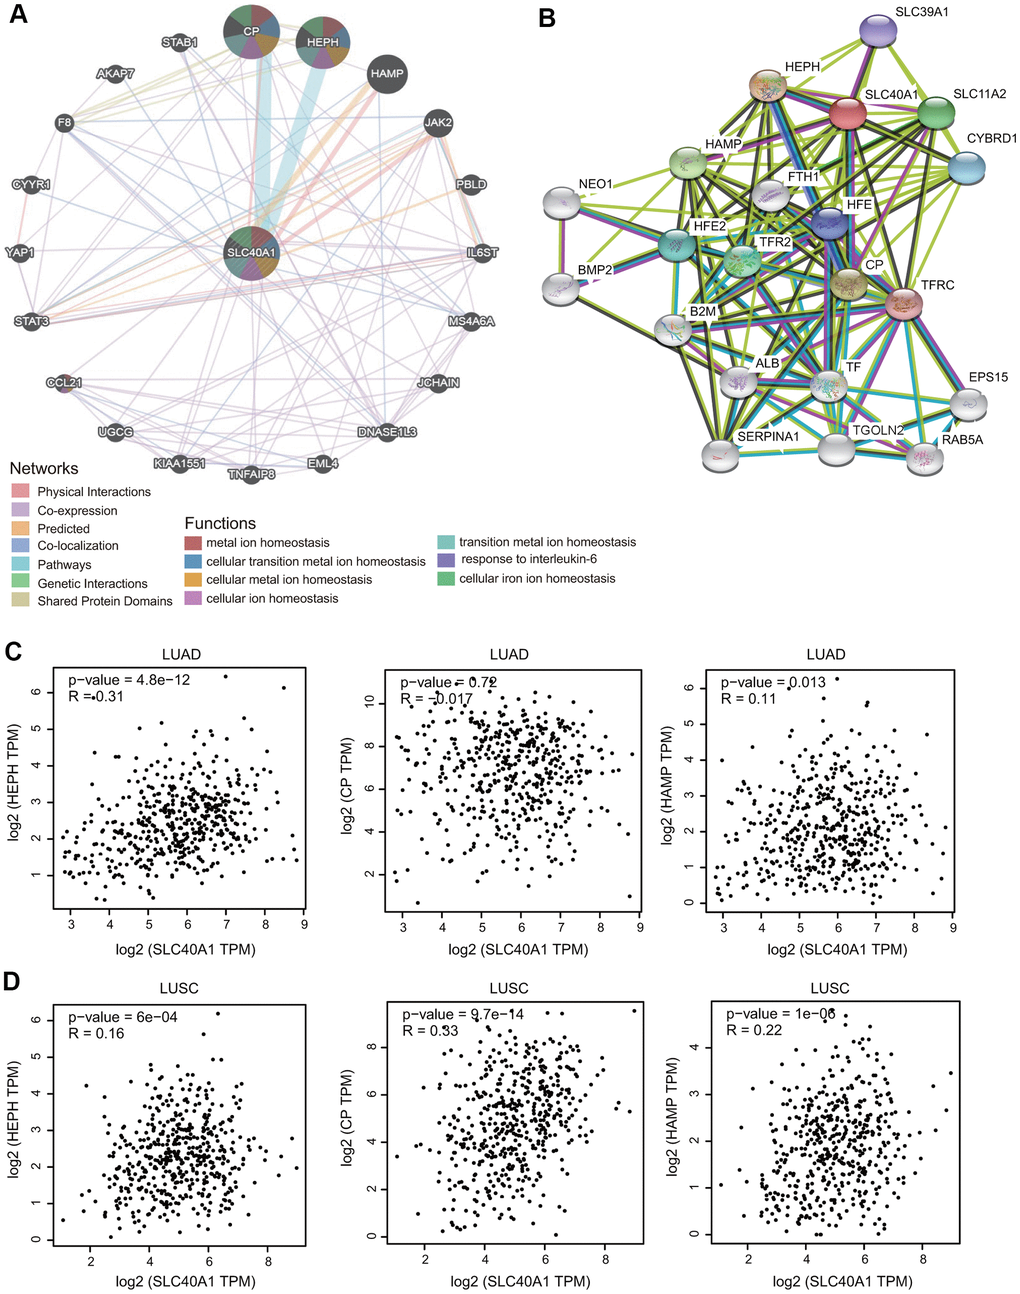
Figure 5.Interaction network of FPN1. (A) An interaction network for FPN1 was generated through the GeneMANIA database. (B) A PPI network for FPN1 was generated through the STRING database. (C, D) Scatterplots showing the correlation between FPN1 and HEPH, CP and HAMP expression in LUAD and LUSC.