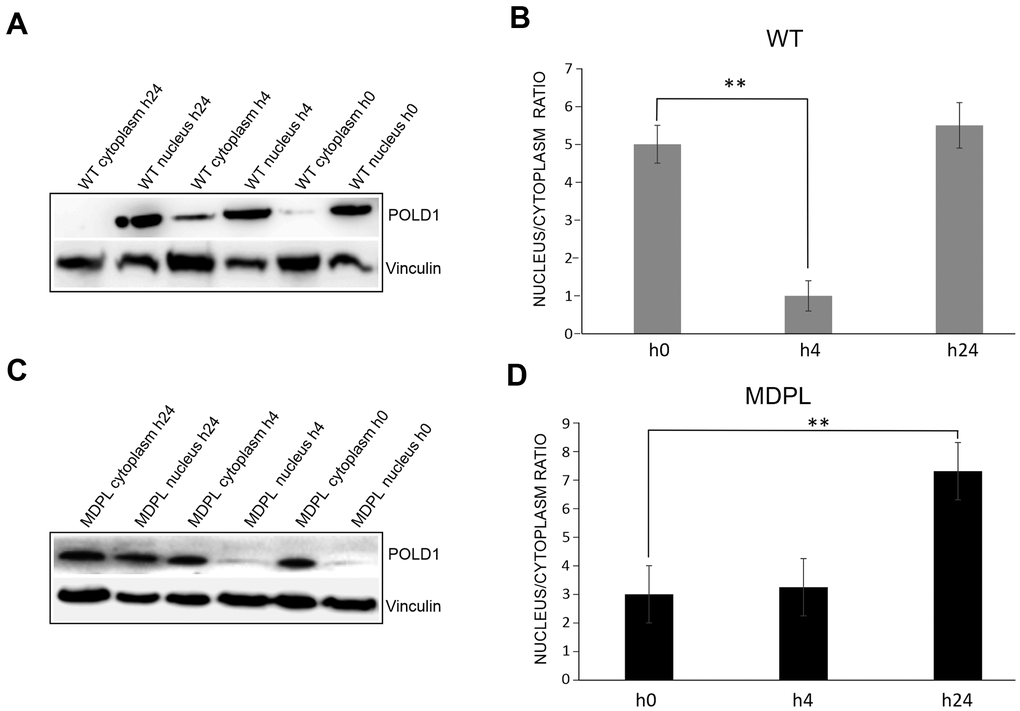
Figure 5.Western blot analysis of Polδ from MDPL and WT HDFs after 1 Gy-X-irradiation. (A) Western blot and (B) densitometric analysis of Polδ nucleus/cytoplasm ratio protein levels after 1 Gy-X-irradiation in WT-HDFs. (**P<0.01). (C) Western blot and (D) densitometric analysis of Polδ nucleus/cytoplasm ratio protein levels after 1 Gy-X-irradiation in MDPL-HDFs. (**P<0.01). Data are presented as means ± SD.