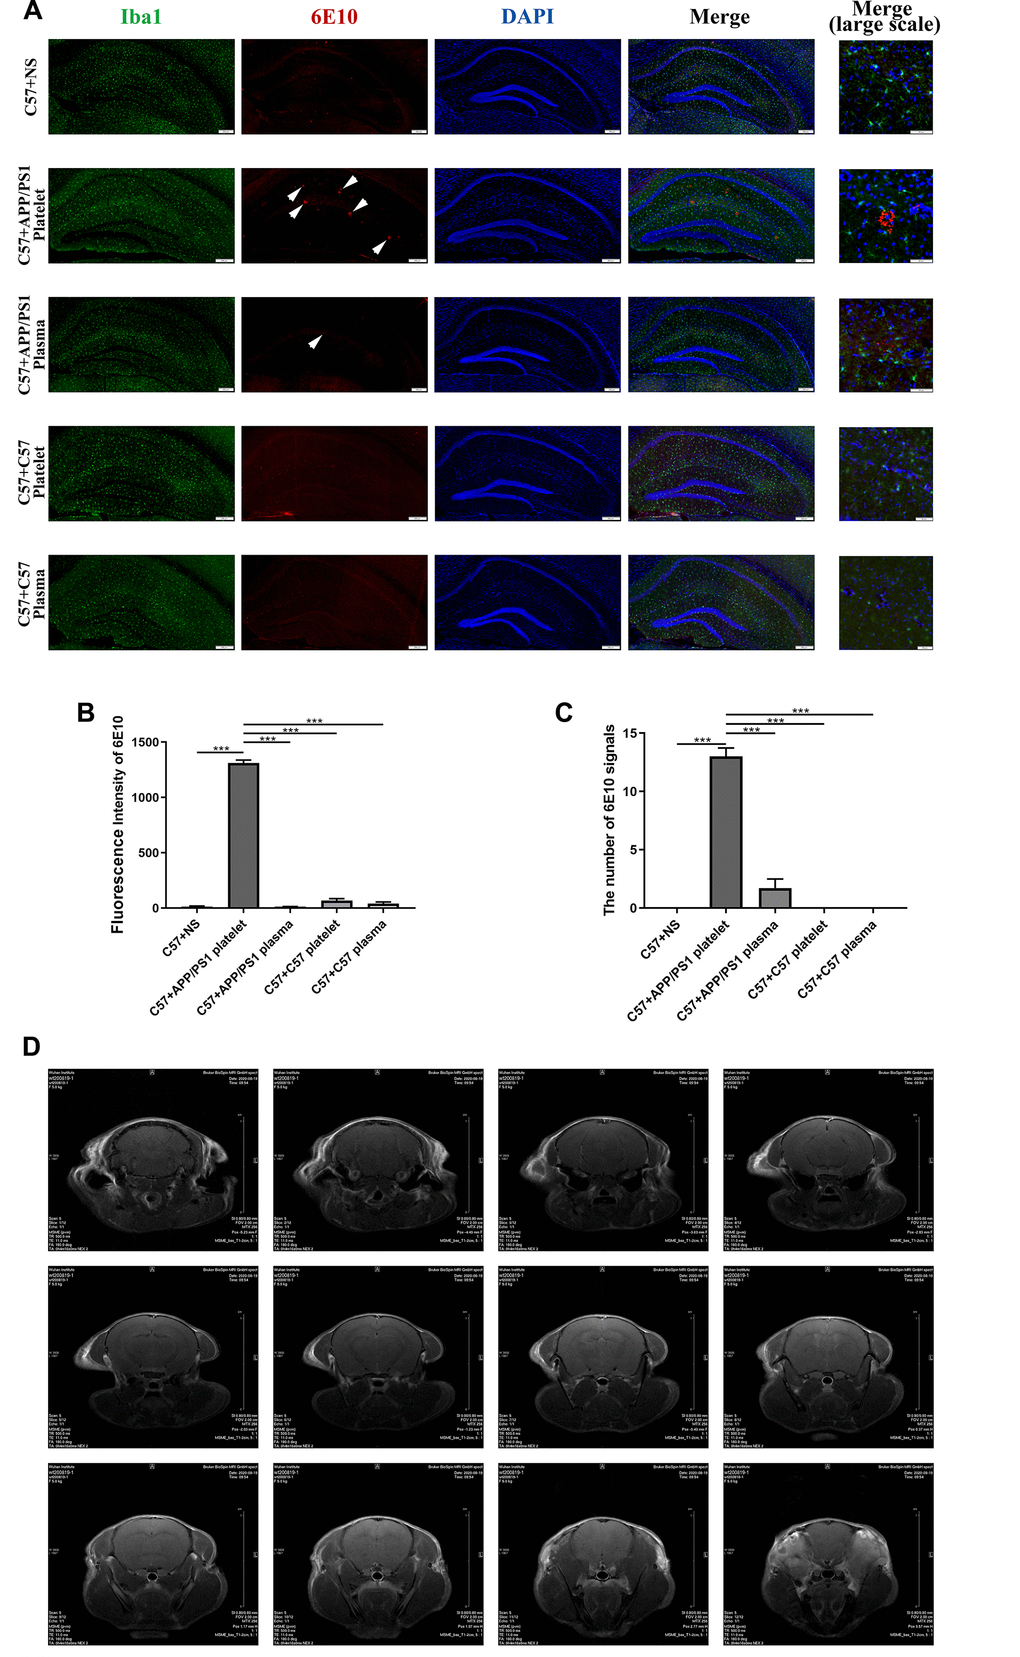
Figure 4.Effects of tail vein injection of plasma or platelets on AD related indexes of blood and brain tissue in mice. (A) IF staining of brain slices with anti-Iba1 (green) and anti-6E10 (red) antibodies, and the nucleus was stained with DAPI (blue). The arrow indicates the expression of 6E10, which labels the Aβ protein. (B) Fluorescence intensity of 6E10. (C) The number of 6E10 signals. Each group contained 8 mice, and 6 similar coronal sections were selected from each brain for IF staining. Scale bars: high-magnification images = 50 μm, other images = 200 μm. ***P<0.001 compared with C57+APP/PS1 platelets. (D) Brain image of a C57 mouse by MRI.
(E) Brain image of a C57+APP/PS1 platelet mouse by MRI. (F) Quantity of platelets. (G) Volume of platelets. Each group included 8 mice. No significant differences were observed between groups. (H) Aβ1-40, Aβ1-42 and tau protein levels per unit of platelets. (I) Aβ1-40 levels in platelets. (J) Aβ1-42 levels in platelets. (K) Tau levels in platelets. Each group included 8 mice. *P<0.05 compared with C57+NS and #P<0.05 compared with C57+APP/PS1 platelets.