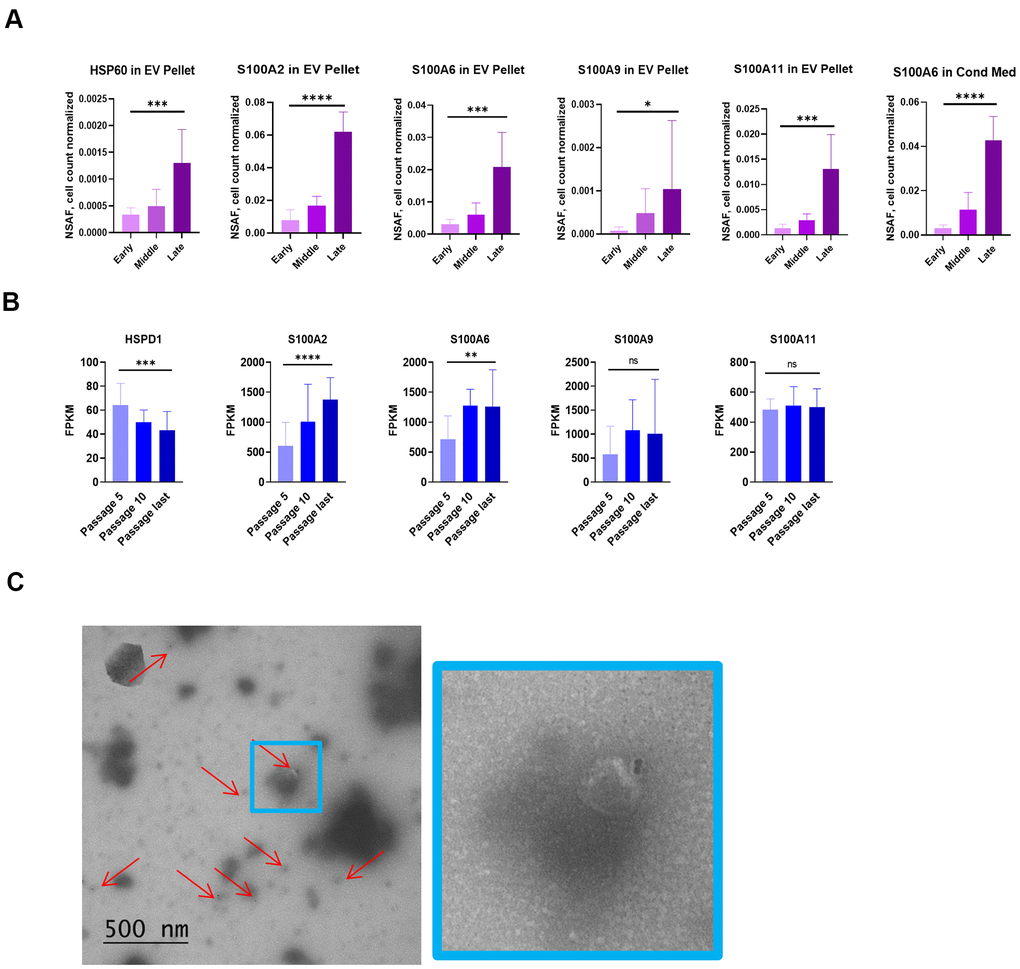
Figure 6.NOK senescence displays important distinguishing characteristics. (A) Mass spectrometry analysis of proposed SASP additions. Selected proteins significantly increased in EV pellet or CM (Mean ± SD). Y-axis scales differ. (B) mRNA levels of proposed SASP additions. (Mean ± SD). Y-axis scales differ. (C) TEM of vesicles from EV pellet labelling for surface HSP60 (left, and 4x enlargement, right). For Figure 6A, 6B, *p<0.05, **p<0.01, ***p<0.001, **** p<0.0001.