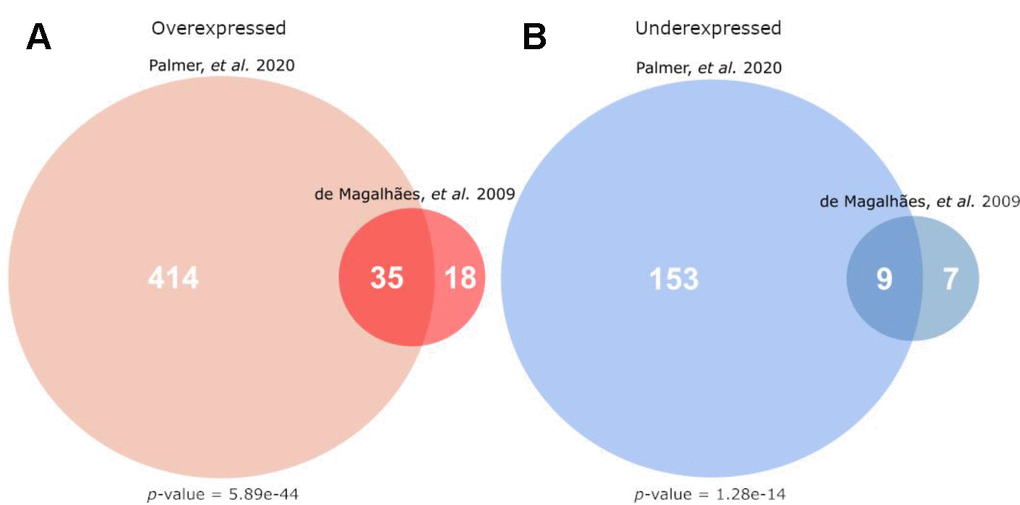
Figure 1.Overlap of this current work’s meta-analysis (Palmer et al.) with the microarray signature of mammalian ageing currently hosted on GenAge (de Magalhães, et al.) [4]). (A) Gives the overlap for genes overexpressed with age, while (B) gives the overlap for genes underexpressed with age. The p-values given are the result of a hypergeometric test, testing the significance of the given overlap using all other protein-coding genes as a background (i.e. all genes not differentially expressed in the direction of the given analysis).
Figure 1 — Ageing transcriptome meta-analysis reveals similarities and differences between key mammalian tissues | Aging