Submit an Article
Navigate
Home
Editorial Board
Editorial Policies
Current Volume
Archive
Scientific Integrity
Publication Ethics Statements
Interviews with Outstanding Authors
Newsroom
Sponsored Conferences
Podcast
Contact
Special Collections
Submit an Article
Online ISSN: 1945-4589
Research Paper
|
Volume 13, Issue 6
|
pp. 8369–8379
A dynamic nomogram for predicting diabetic macular edema in type 2 diabetes patients based on plasma cytokines
Back to article
Figure 3
(3 of 7)
−
100%
+
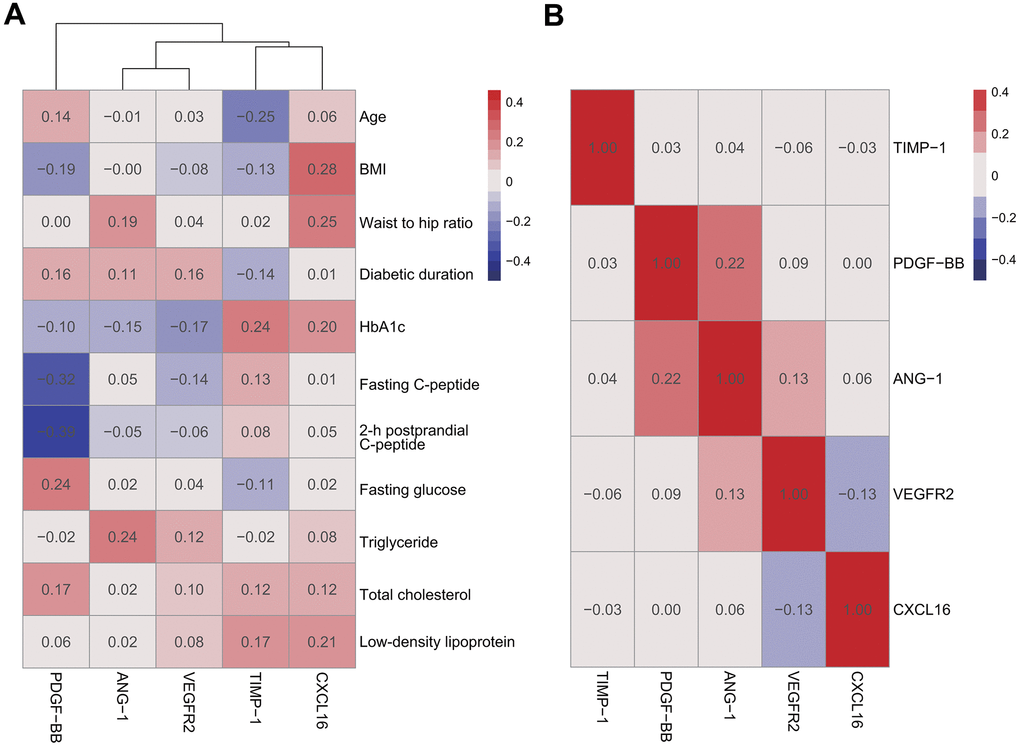
Figure 3.
Pearson correlation analysis of DME group.
There were no significant positive correlations between plasma cytokines and clinical characteristics (
A
) among plasma cytokines (
B
).