Submit an Article
Navigate
Home
Editorial Board
Editorial Policies
Current Volume
Archive
Scientific Integrity
Publication Ethics Statements
Interviews with Outstanding Authors
Newsroom
Sponsored Conferences
Podcast
Contact
Special Collections
Submit an Article
Online ISSN: 1945-4589
Research Paper
|
Volume 13, Issue 6
|
pp. 8369–8379
A dynamic nomogram for predicting diabetic macular edema in type 2 diabetes patients based on plasma cytokines
Back to article
Figure 1
(1 of 7)
−
100%
+
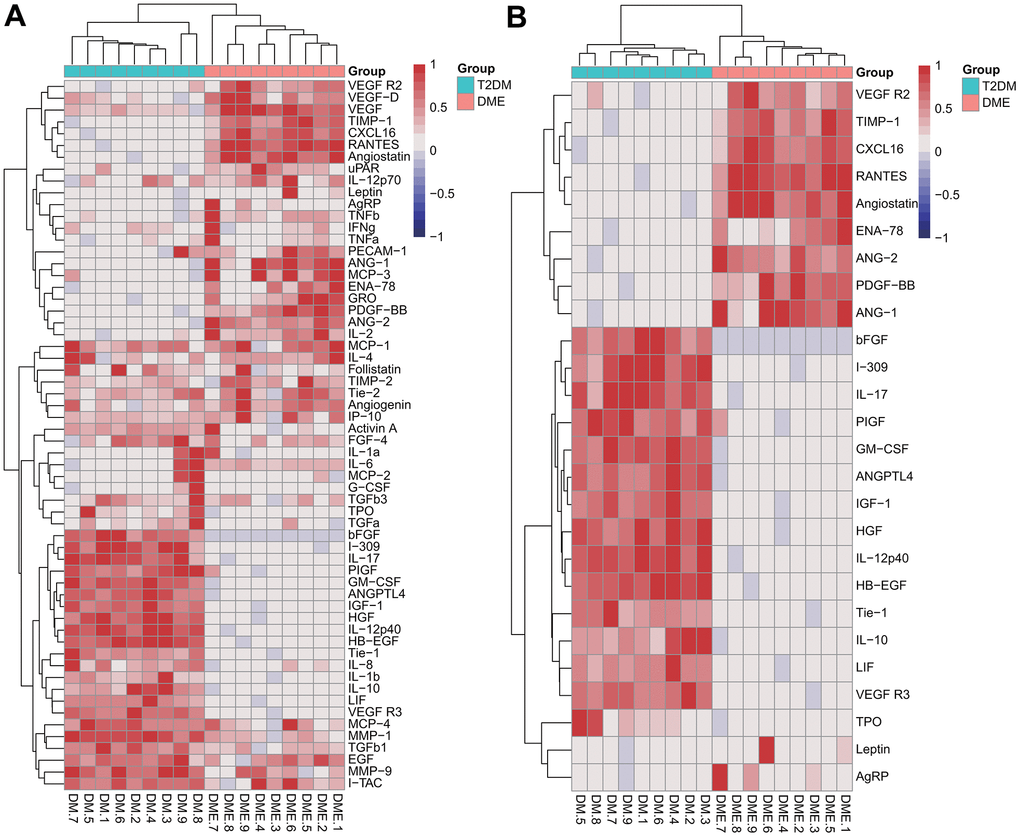
Figure 1.
Semi-quantitative results of cytokine analysis in the pilot cohort.
Heatmaps of the relative changes of 60 plasma cytokines (
A
) and 26 cytokines with a fold change > 4 or < 0.25 (
B
).