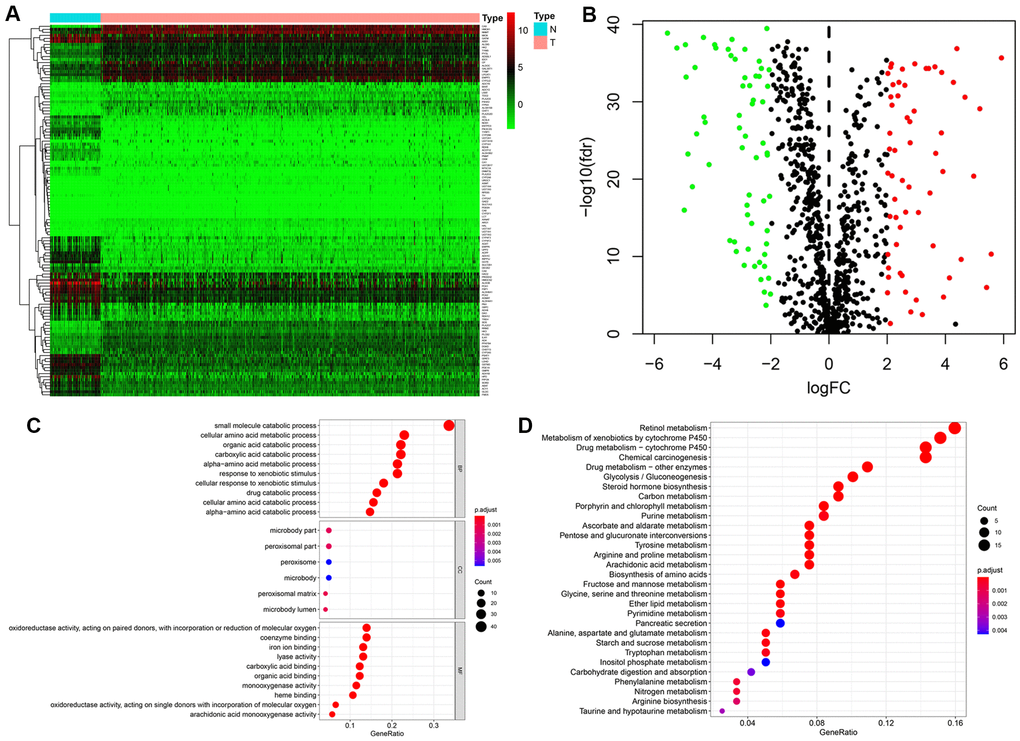
Figure 1.Identification of differentially expressed metabolism-related genes (MRGs) and functional enrichment analysis. (A) Heatmap of the 123 differently expressed MRGs between kidney cancer and normal tissues. (B) Volcano plot of the 123 differently expressed MRGs. Red and green dots indicate significantly upregulated and downregulated genes, respectively; black dots indicate similarly expressed genes. (C) GO analysis showing the enrichment of the differently expressed MRGs in biological process (BP), cellular component (CC), and molecular function (MF) terms. (D) KEGG pathway analysis for the differentially expressed MRGs.