Submit an Article
Navigate
Home
Editorial Board
Editorial Policies
Current Volume
Archive
Scientific Integrity
Publication Ethics Statements
Interviews with Outstanding Authors
Newsroom
Sponsored Conferences
Podcast
Contact
Special Collections
Submit an Article
Online ISSN: 1945-4589
Research Paper
|
Volume 13, Issue 6
|
pp. 8155–8176
FAM72 serves as a biomarker of poor prognosis in human lung adenocarcinoma
Back to article
Figure 4
(4 of 9)
−
100%
+
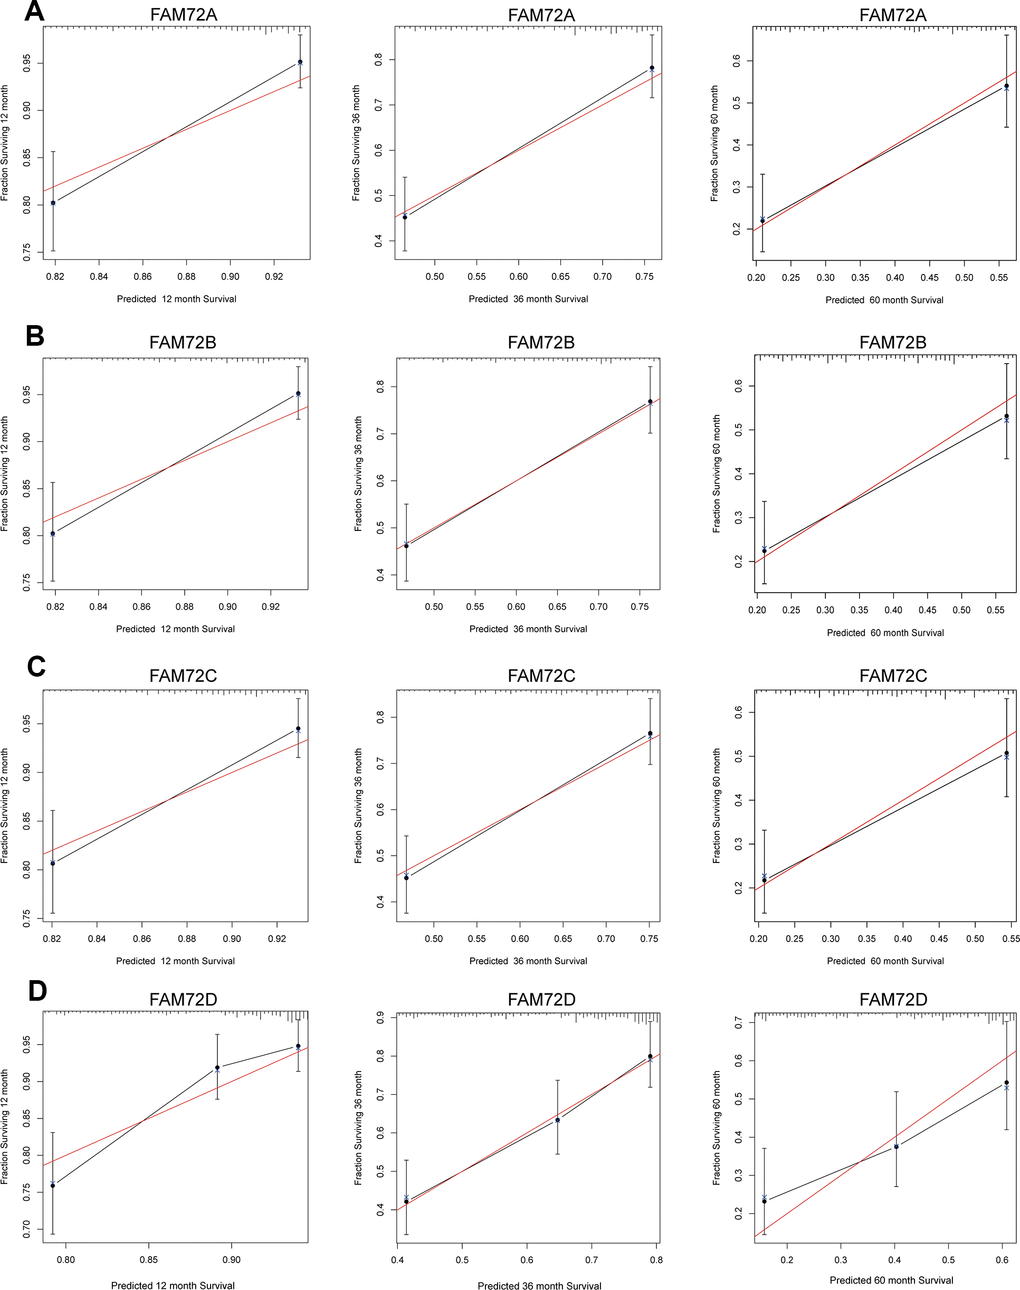
Figure 4.
Calibration curve for predicting the probability of 1-, 3- and 5-year OS for LUAD patients.
(
A
–
D
) The calibration curve of the nomogram in LUAD from TCGA data.