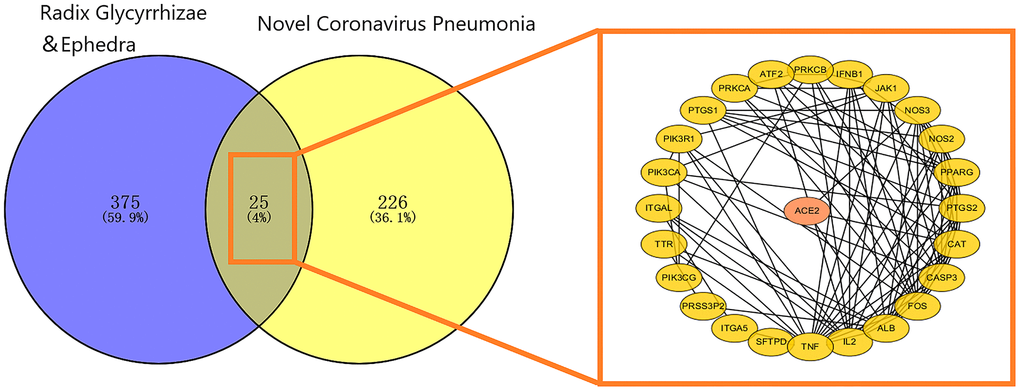
Figure 4.Mapping relation between Glycyrrhiza and Ephedra and COVID-19. The 25 intersected targets are presented as a PPI network. The ellipse represents the target, and the black line represents the relationship between the targets.
Figure 4 — Chemical composition and pharmacological mechanism of ephedra-glycyrrhiza drug pair against coronavirus disease 2019 (COVID-19) | Aging