Submit an Article
Navigate
Home
Editorial Board
Editorial Policies
Current Volume
Archive
Scientific Integrity
Publication Ethics Statements
Interviews with Outstanding Authors
Newsroom
Sponsored Conferences
Podcast
Contact
Special Collections
Submit an Article
Online ISSN: 1945-4589
Research Paper
|
Volume 13, Issue 5
|
pp. 7570–7588
Low expression of NLRP1 is associated with a poor prognosis and immune infiltration in lung adenocarcinoma patients
Back to article
Figure 2
(2 of 6)
−
100%
+
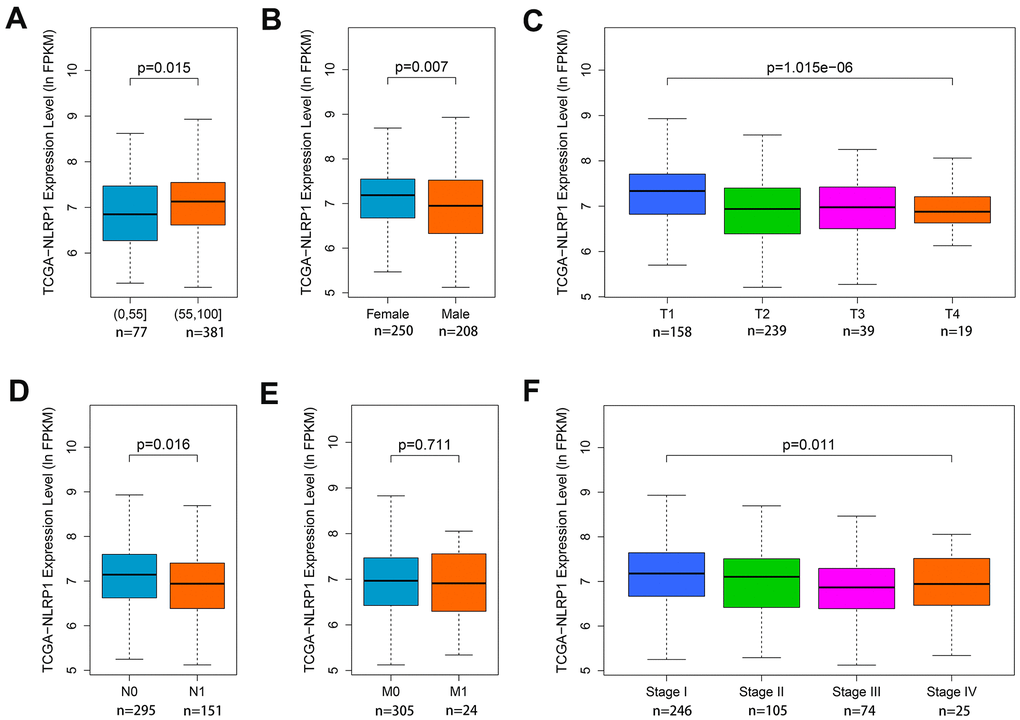
Figure 2.
Associations of NLRP1 expression with clinical parameters.
(
A
) Age (
p < 0.05
); (
B
) Gender (
p < 0.05
); (
C
) T stage (
p < 0.05
); (
D
) N stage (
p < 0.05
); (
E
) M stage (
p > 0.05
) and (
F
) TNM stage (
p < 0.05
).
Figure 2 — Low expression of NLRP1 is associated with a poor prognosis and immune infiltration in lung adenocarcinoma patients | Aging