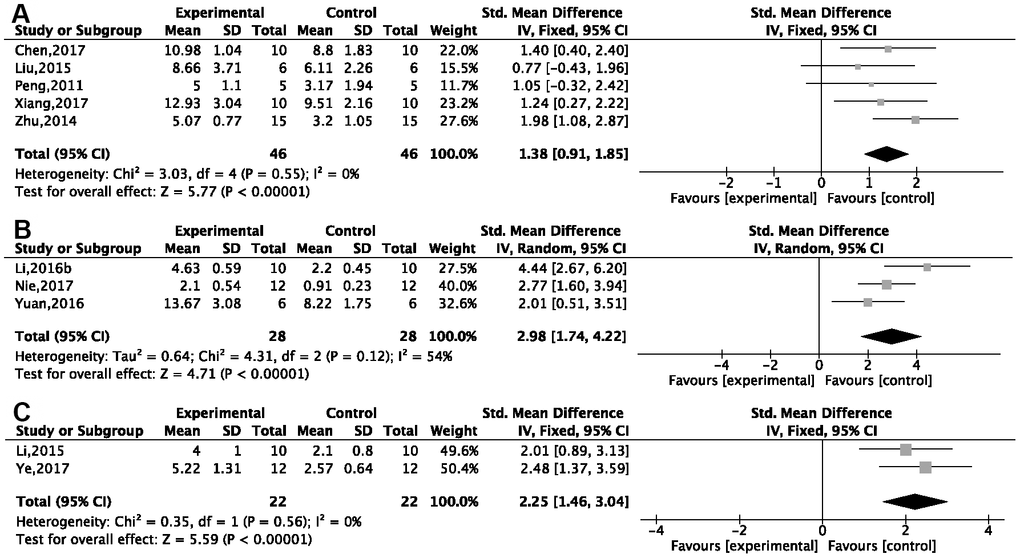
Figure 4.Forest plots of the number of platform crossings in the Morris water maze. Improvements were seen in (A) the d-gal injection model; (B) APP/PS1 transgenic mice; (C) the Aβ1-42 injection model in the ginsenoside Rg1 group compared with a control group.