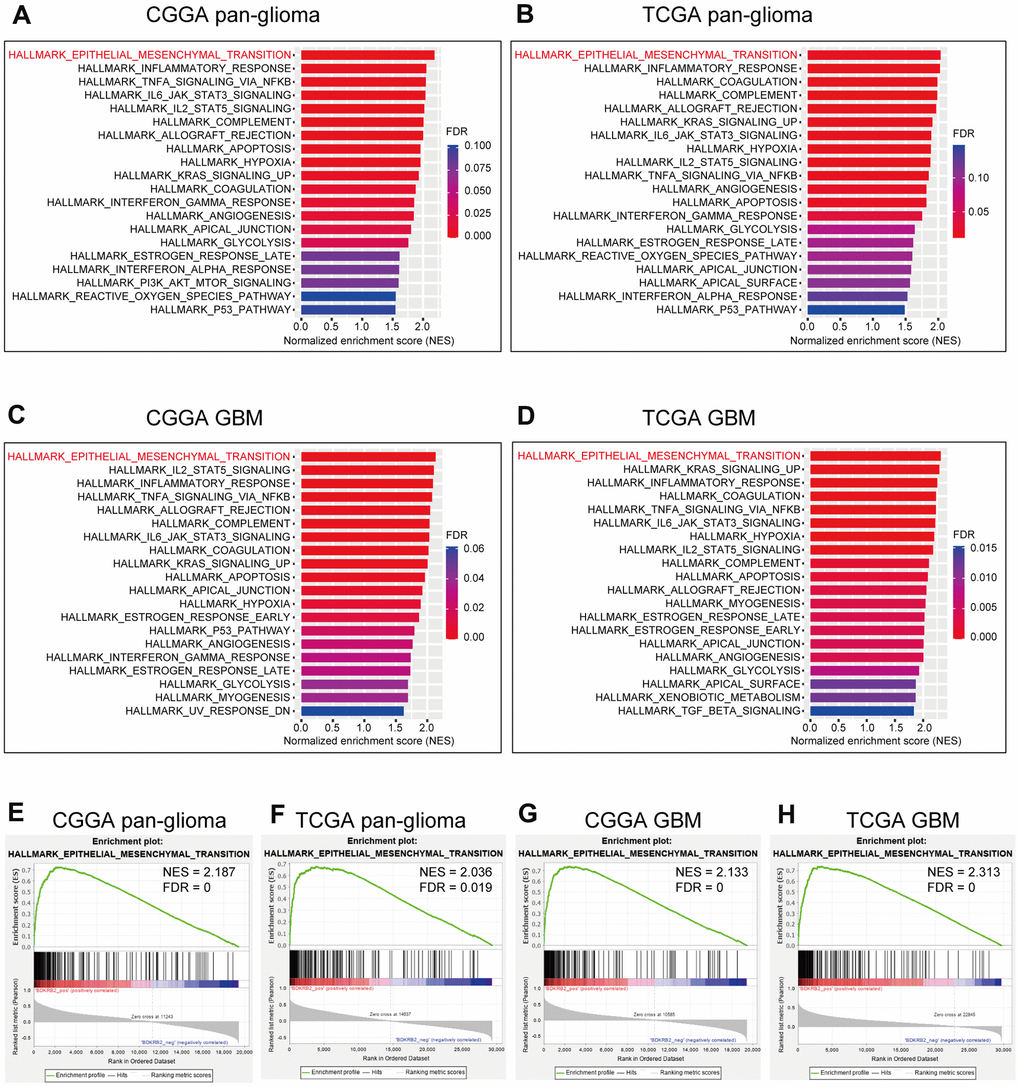
Figure 3.GSEA of BDKRB2 in pan-glioma (A, B) and glioblastoma (C, D), and GSEA plots for EMT enrichment according to BDKRB2 expression in pan-glioma (E, F) and glioblastoma (G, H).
Figure 3 — BDKRB2 is a novel EMT-related biomarker and predicts poor survival in glioma | Aging