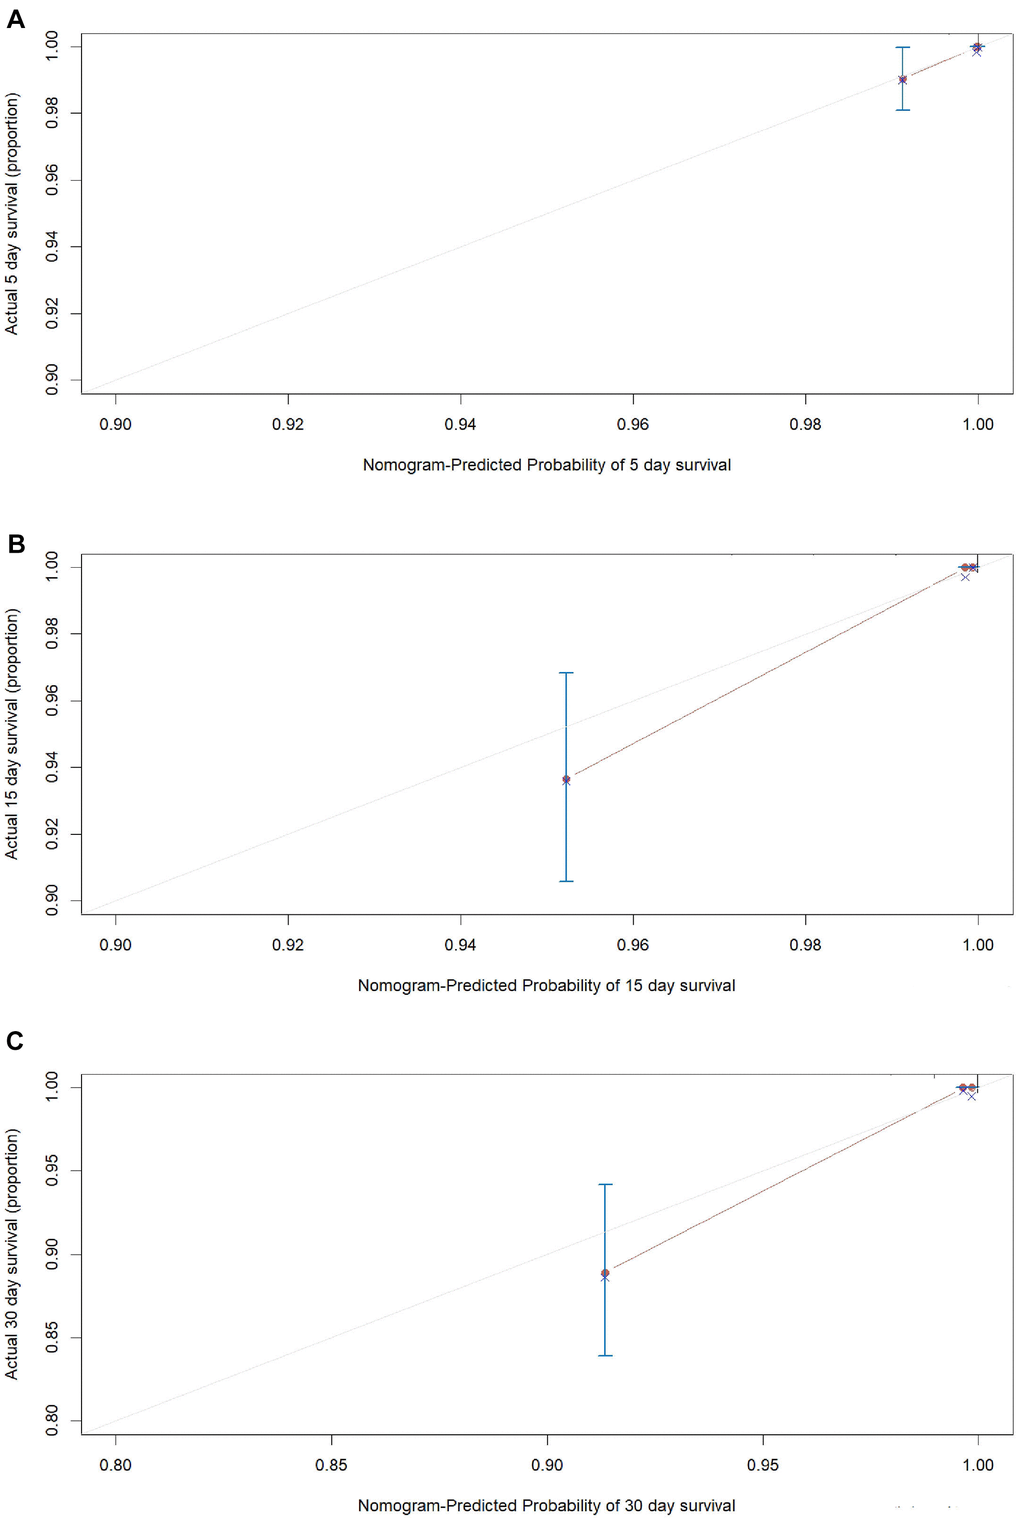
Figure 4.The calibration plots for the probability of in-hospital mortality of COVID-19 in internal validation cohort. Calibration plots of the nomogram predict (A) 5-day, (B) 15-day and (C) 30-day in-hospital mortality in COVID-19 patients in the validation cohort. Nomogram-predicted probability of in-hospital mortality is plotted on the x-axis; actual in-hospital mortality is plotted on the y-axis.