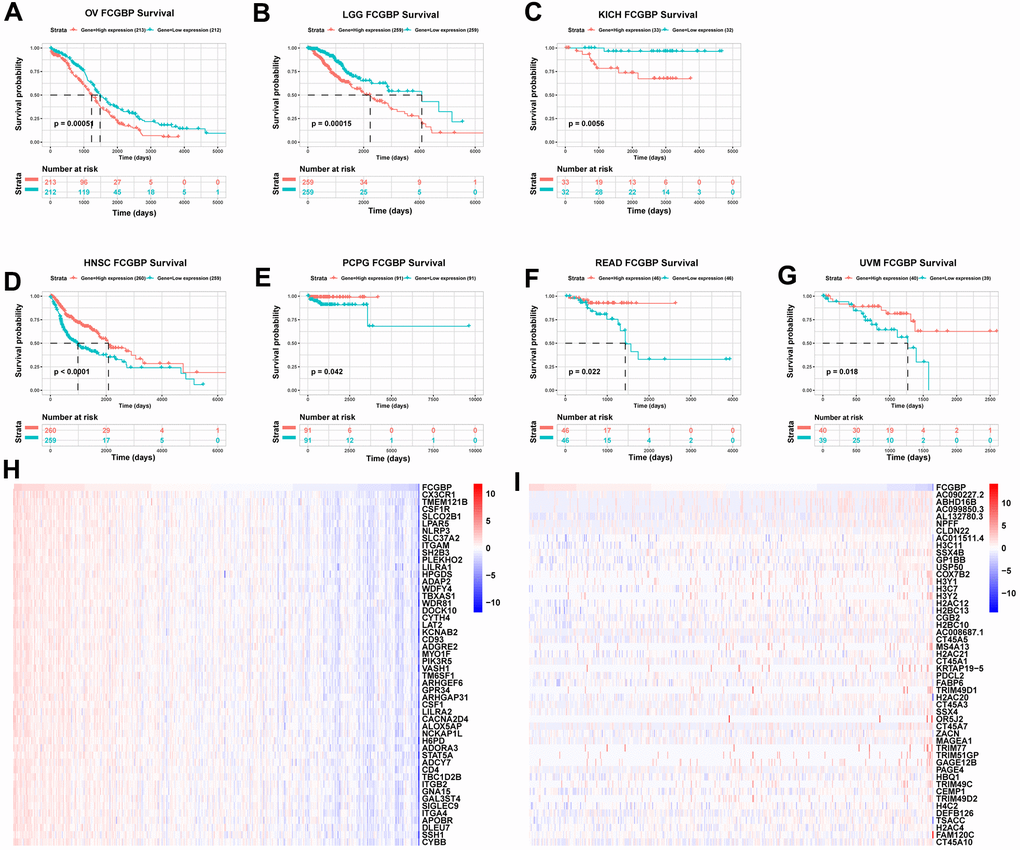
Figure 3.Association between FCGBP expression and cancer prognosis. (A–G) Kaplan–Meier analysis of overall survival in TCGA. Results with logrank p <0.05 are shown. (H) Top 50 genes most positively associated with FCGBP are shown in a heatmap. (I) Top 50 genes most negatively associated with FCGBP are shown in a heatmap.