Submit an Article
Navigate
Home
Editorial Board
Editorial Policies
Current Volume
Archive
Scientific Integrity
Publication Ethics Statements
Interviews with Outstanding Authors
Newsroom
Sponsored Conferences
Podcast
Contact
Special Collections
Submit an Article
Online ISSN: 1945-4589
Research Paper
|
Volume 13, Issue 5
|
pp. 7382–7396
Integrative analysis of exosomal microRNA-149-5p in lung adenocarcinoma
Back to article
Figure 1
(1 of 9)
−
100%
+
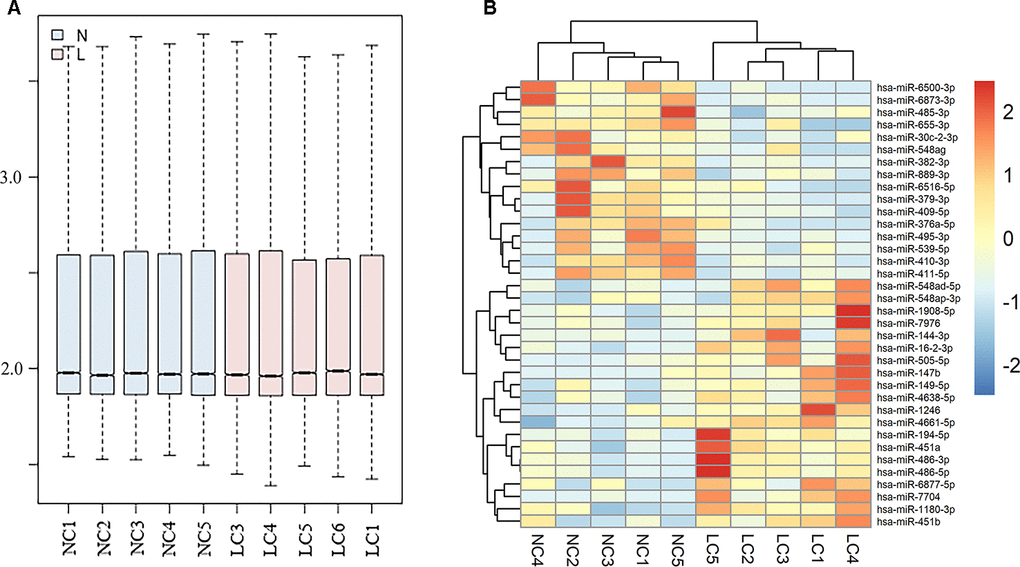
Figure 1.
Differently expressed exosomal miRNAs in GSE111803.
(
A
) Normalization of raw data in GSE111803. (
B
) The heat map of differently expressed exosomal miRNAs in GSE111803. (NC: negative control; LC: lung adenocarcinoma).