Submit an Article
Navigate
Home
Editorial Board
Editorial Policies
Current Volume
Archive
Scientific Integrity
Publication Ethics Statements
Interviews with Outstanding Authors
Newsroom
Sponsored Conferences
Podcast
Contact
Special Collections
Submit an Article
Online ISSN: 1945-4589
Research Paper
|
Volume 13, Issue 5
|
pp. 7284–7299
Prognostic value of glycolysis markers in head and neck squamous cell carcinoma: a meta-analysis
Back to article
Figure 5
(5 of 6)
−
100%
+
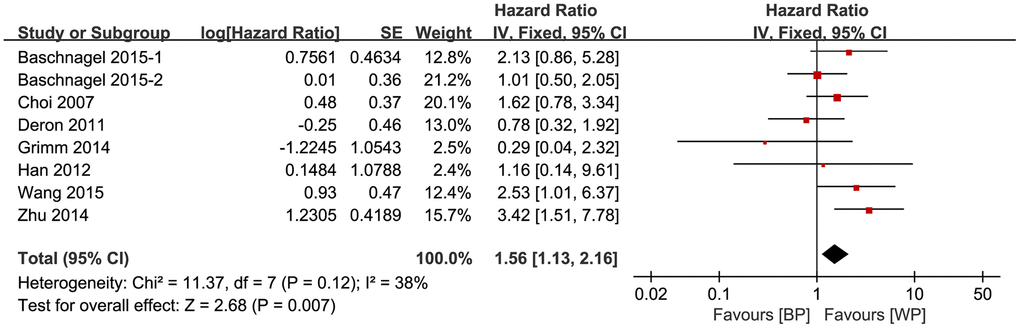
Figure 5.
Association between the expression levels of glycolysis markers and DFS after removing the source of heterogeneity.