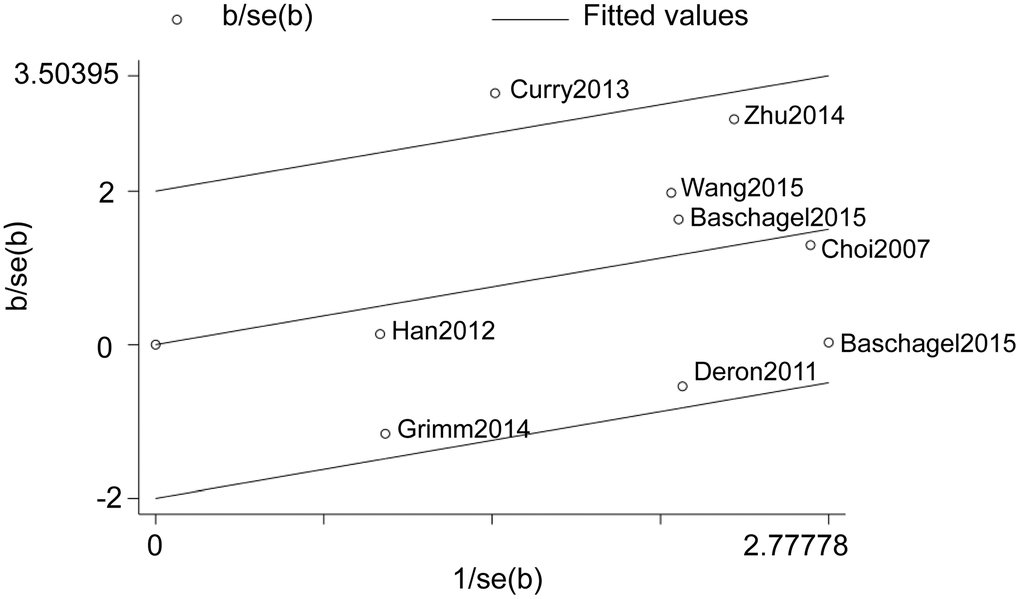
Figure 4.Galbraith plot analysis shows the source of heterogeneity in studies regarding the association between the expression levels of glycolysis markers and DFS in HNSCC patients.
Figure 4 — Prognostic value of glycolysis markers in head and neck squamous cell carcinoma: a meta-analysis | Aging