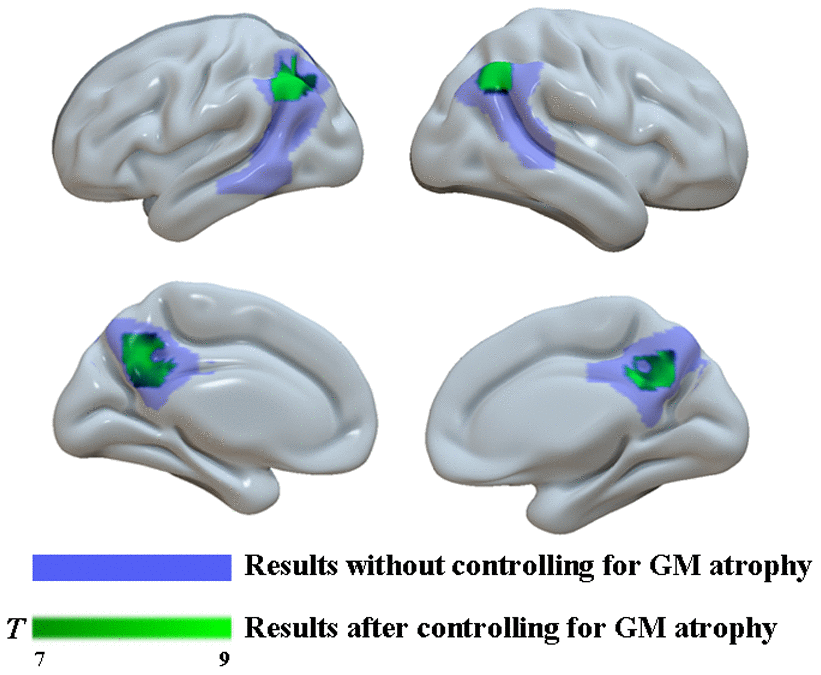
Figure 5.Group differences in18F-FDG SUVR by using whole-brain confirmatory analysis with controlling for GM atrophy between the two groups. Results without controlling for GM atrophy were shown in blue and results after controlling for GM atrophy were shown in green.