Submit an Article
Navigate
Home
Editorial Board
Editorial Policies
Current Volume
Archive
Scientific Integrity
Publication Ethics Statements
Interviews with Outstanding Authors
Newsroom
Sponsored Conferences
Podcast
Contact
Special Collections
Submit an Article
Online ISSN: 1945-4589
Research Paper
|
Volume 13, Issue 5
|
pp. 6957–6981
Identification of a ten-long noncoding RNA signature for predicting the survival and immune status of patients with bladder urothelial carcinoma based on the GEO database: a superior machine learning model
Back to article
Figure 10
(11 of 12)
−
100%
+
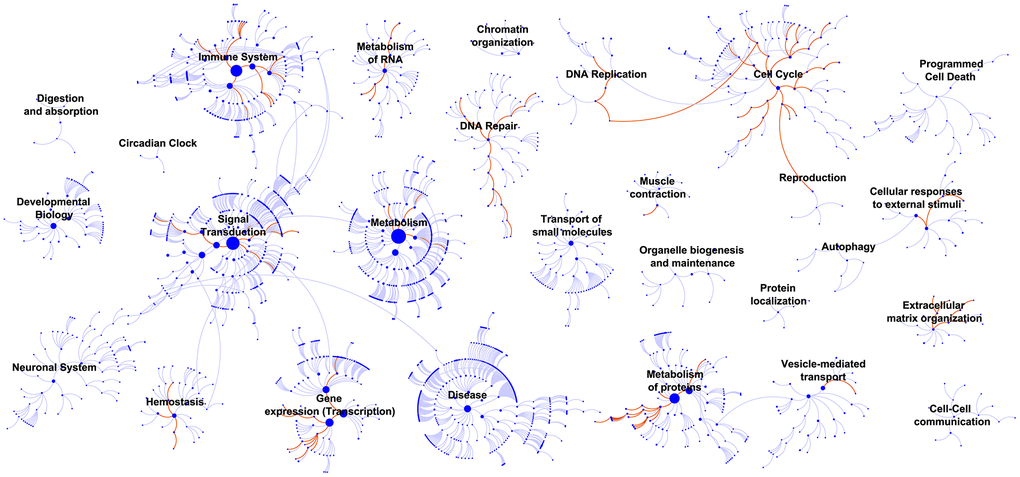
Figure 10.
GSEA identified biological processes that correlated with the 10-lncRNA signature.
Enriched canonical pathways (FDR < 0.01) were mapped in the whole pathway overview. Each dot represents a function, and each line indicates a pathway.