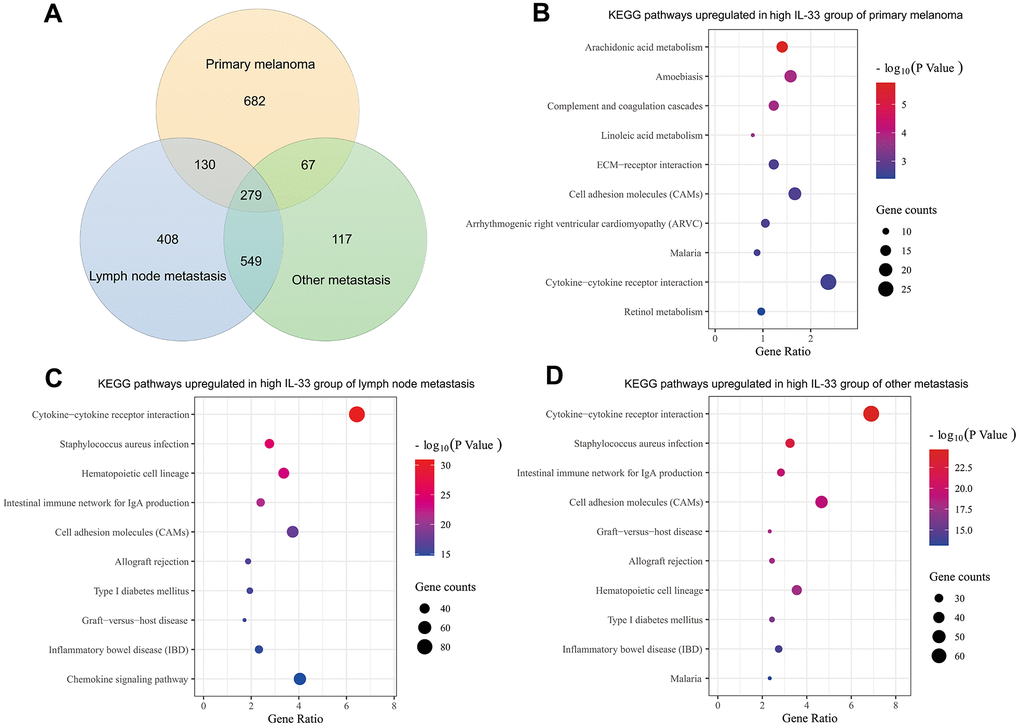
Figure 4.Differentially expressed genes and enriched pathways. (A) Venn diagram depicting genes expressed at higher levels in the high IL-33 groups; bubble plots depicting upregulated KEGG pathways in the high IL-33 groups of the primary melanoma sub-cohort (B), the LN metastasis sub-cohort (C), and the other metastasis sub-cohort (D).