Submit an Article
Navigate
Home
Editorial Board
Editorial Policies
Current Volume
Archive
Scientific Integrity
Publication Ethics Statements
Interviews with Outstanding Authors
Newsroom
Sponsored Conferences
Podcast
Contact
Special Collections
Submit an Article
Online ISSN: 1945-4589
Research Paper
|
Volume 13, Issue 5
|
pp. 6740–6751
Interleukin-33 modulates immune responses in cutaneous melanoma in a context-specific way
Back to article
Figure 2
(2 of 5)
−
100%
+
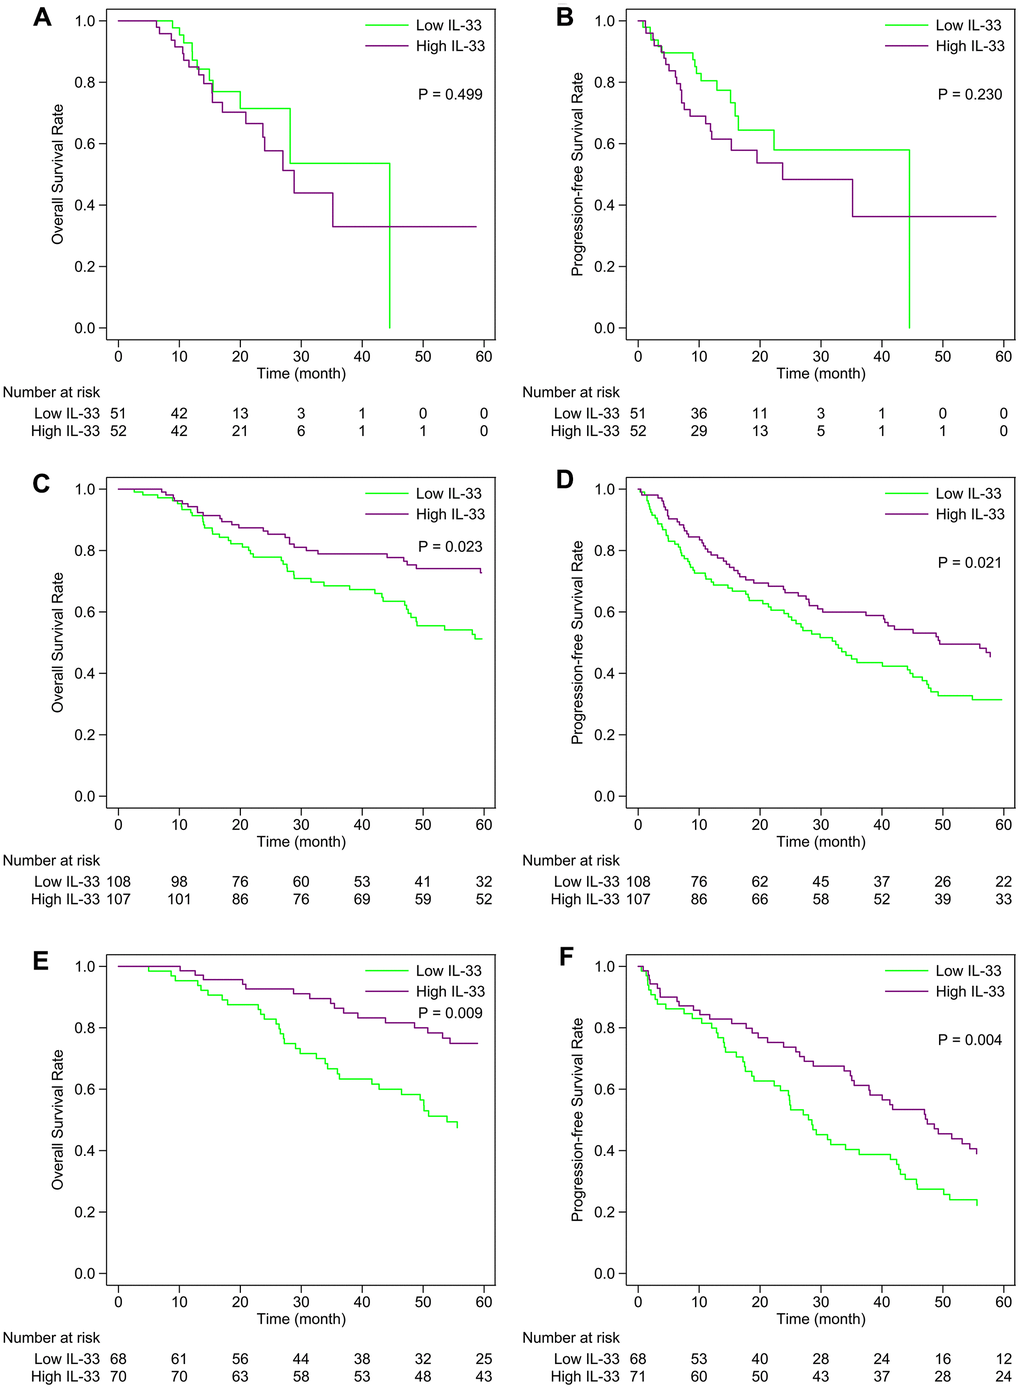
Figure 2.
Kaplan-Meier curves of the high and low IL-33 groups within each sub-cohort.
(
A
,
B
) primary melanoma sub-cohort; (
C
,
D
) lymph node metastasis sub-cohort; (
E
,
F
) other metastasis sub-cohort. P-values were calculated by the log-rank test.