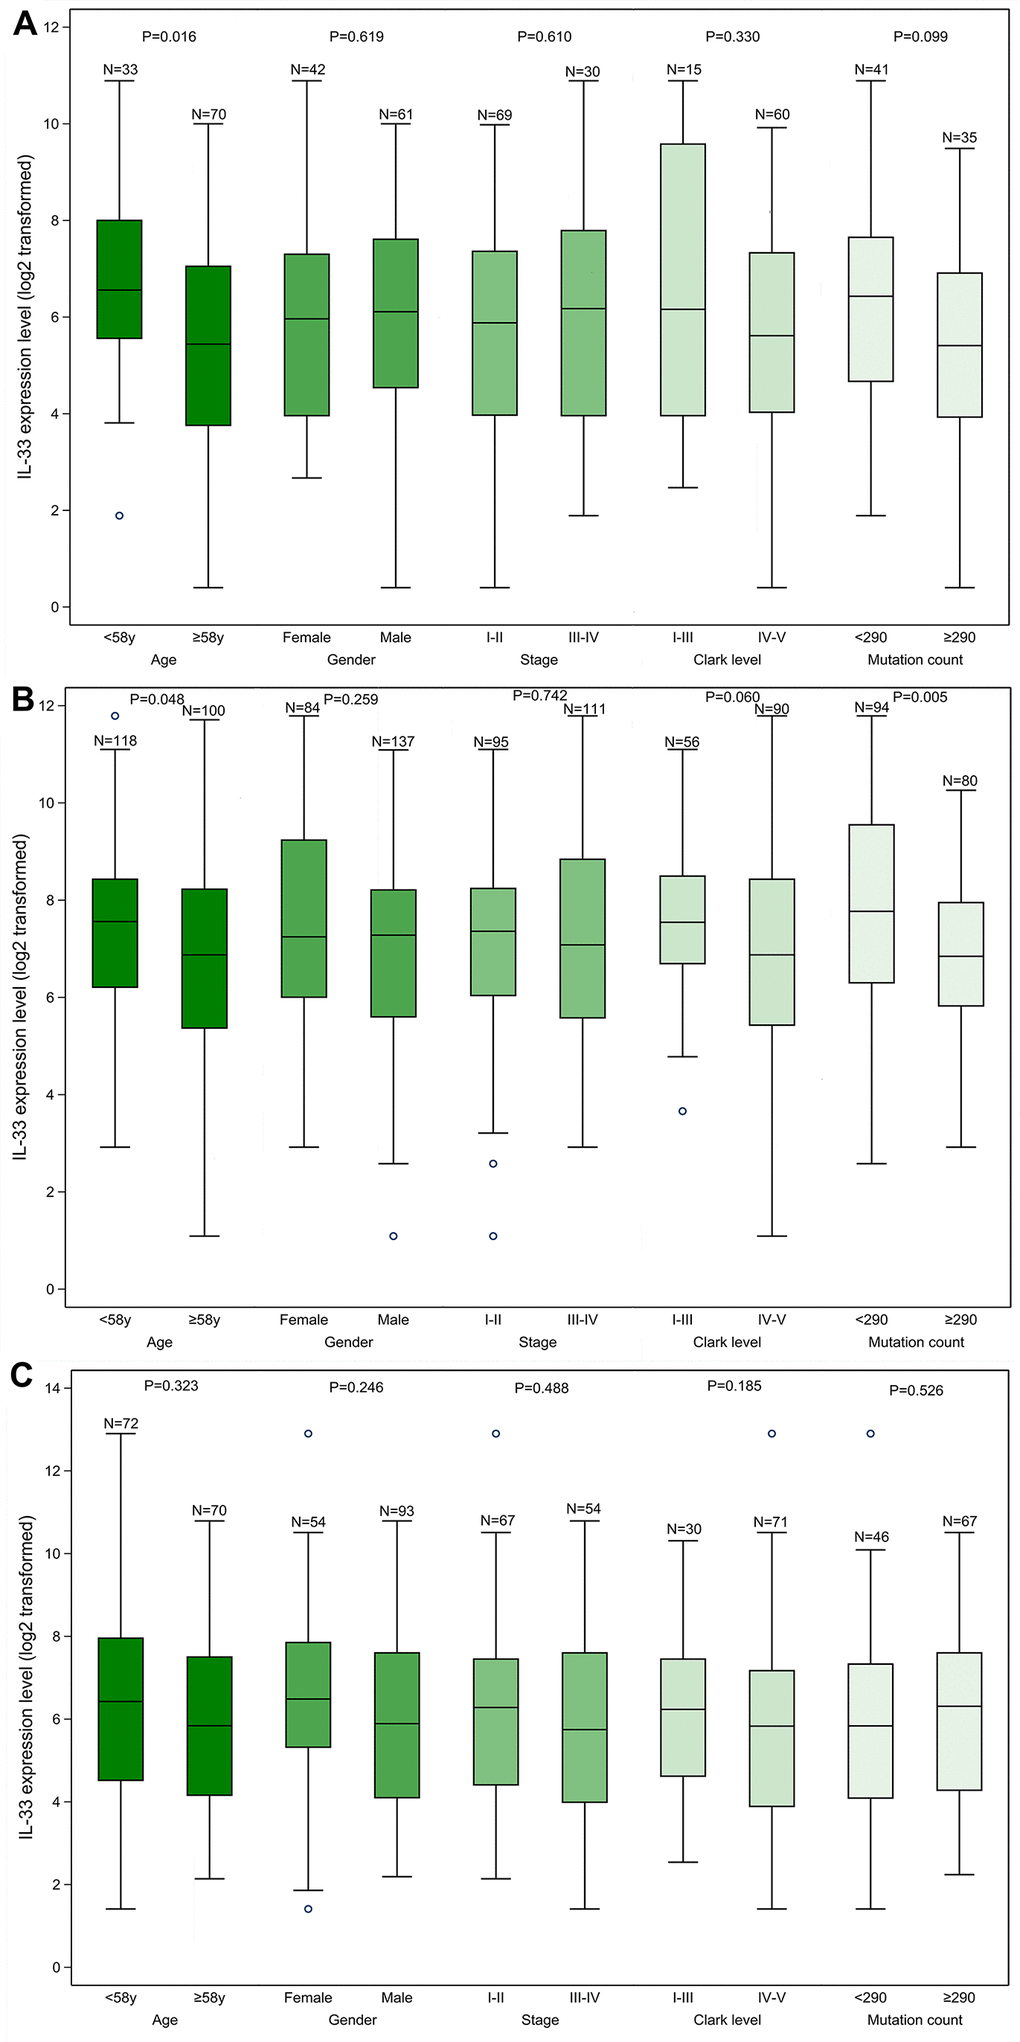
Figure 1.The IL-33 expression level in clinicopathological subgroups. (A) primary melanoma sub-cohort; (B) lymph node metastasis sub-cohort; (C) other metastasis sub-cohort. Boxplots represent values within the interquartile range (IQR) (boxes) and 1.5 × IQR (whiskers). Outliers are plotted as values > 1.5 × IQR (circles). P-values were calculated by the Mann-Whitney U test.