Submit an Article
Navigate
Home
Editorial Board
Editorial Policies
Current Volume
Archive
Scientific Integrity
Publication Ethics Statements
Interviews with Outstanding Authors
Newsroom
Sponsored Conferences
Podcast
Contact
Special Collections
Submit an Article
Online ISSN: 1945-4589
Research Paper
|
Volume 13, Issue 5
|
pp. 6702–6711
The impact of visceral obesity on chronic constipation, inflammation, immune function and cognitive function in patients with inflammatory bowel disease
Back to article
Figure 6
(6 of 6)
−
100%
+
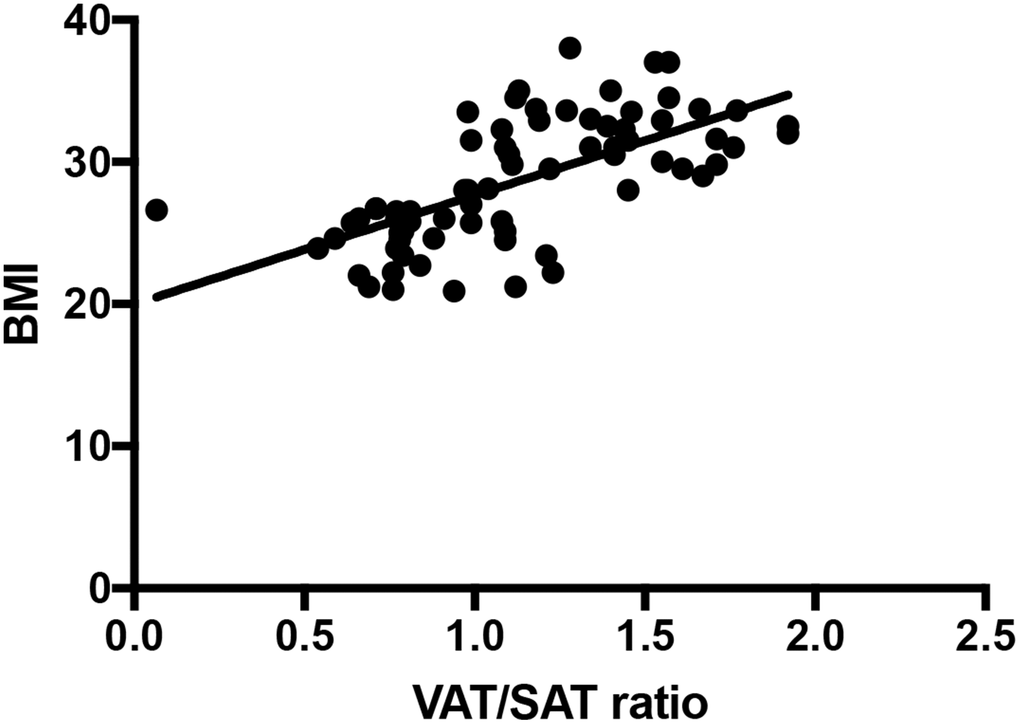
Figure 6.
VAT/SAT ratio correlates with BMI (r = 0.652,
P
< 0.001).