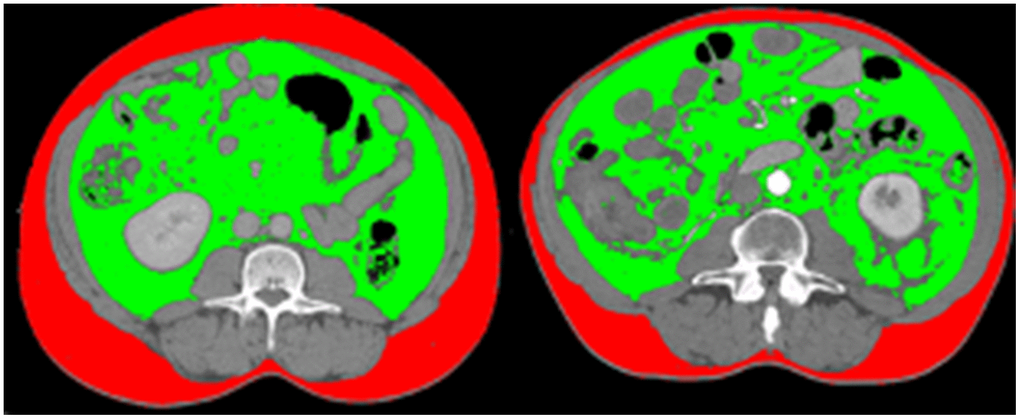
Figure 1.Comparison of visceral obesity of two patients with same BMI. The first patient has lower BMI than the other patient (20.1 kg/m2 vs. 29.3kg/m2), and its VAT/SAT ratio is also lower, which means that patient with lower BMI has less visceral obesity (VAT/SAT ratio: 1.22 vs. 2.48).