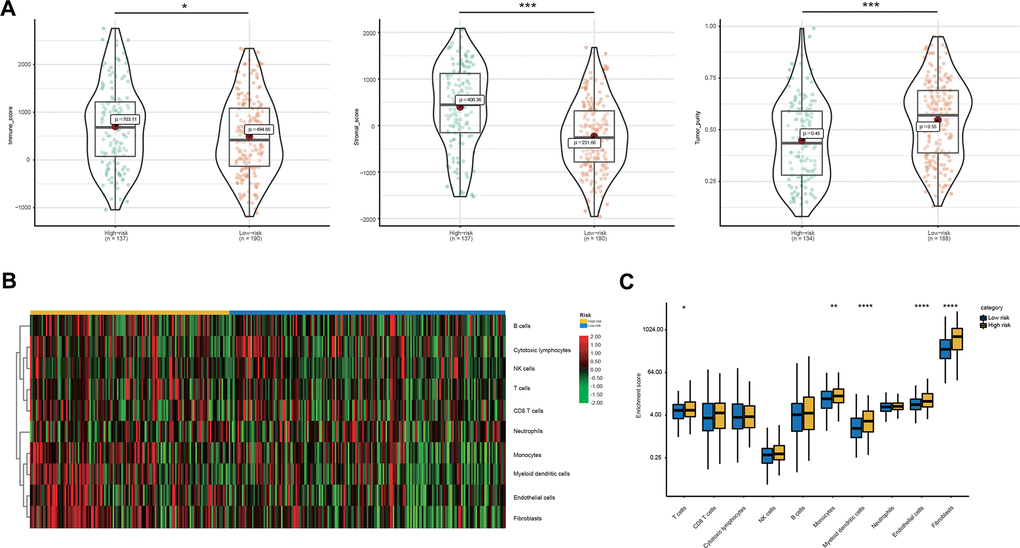
Figure 6.Immune microenvironment features underlying the 23-AS event signature. (A) Violin plots for the immune scores, stromal scores, and tumor purity between the high- and low-risk groups. (B) Heat map for immune cell infiltration between the high- and low-risk groups. (C) The differential expression of immune and stromal cells between the high- and low-risk groups.