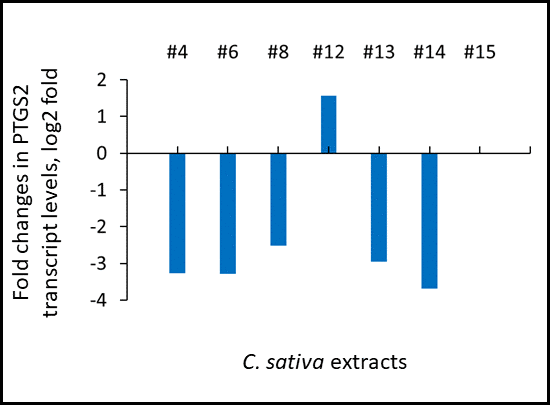
Figure 2.Effects of novel C. sativa extracts on the levels of PTGS2 gene expression as studied by the global transcriptome profiling using RNAseq. Induction of inflammation and treatments were described in the legend to Figure 1. Data are shown as log 2 fold changes as compared to UV-induced tissues. All changes shown here are statistically significant, p adj <0.05, ANOVA-like analysis and pair-wise comparison.