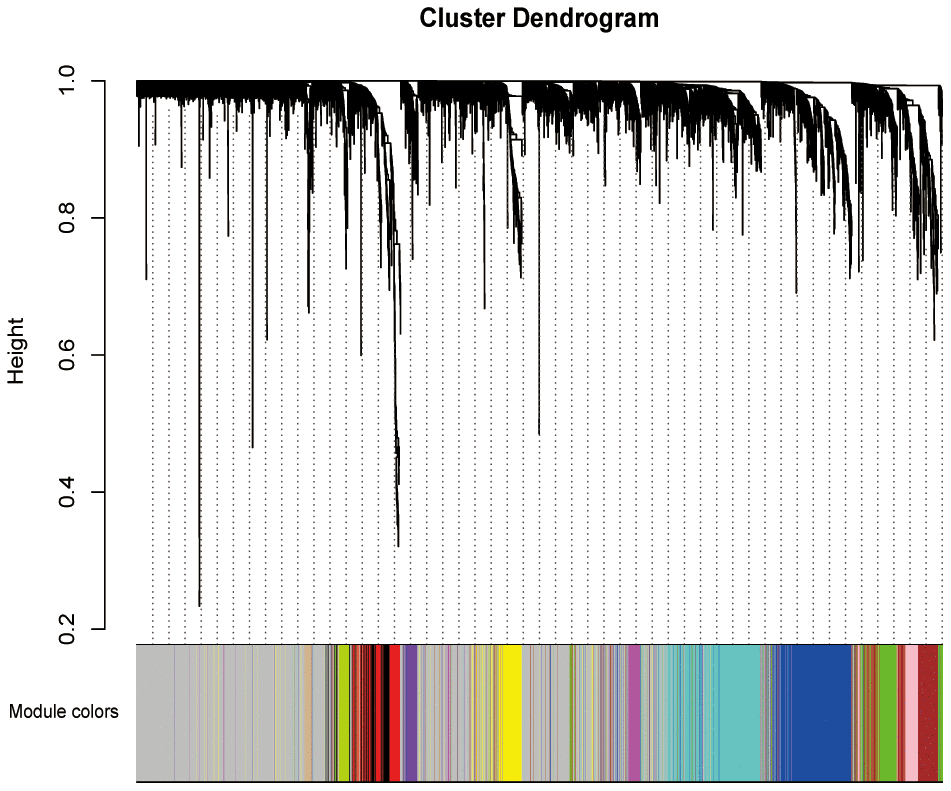
Figure 2.Weighted co-expression network establishment. The cluster dendrogram of the DEGs; each branch represents one gene and the co-expression modules are represented by different colors. DEGs, differentially expression genes.
Figure 2 — Identification of novel candidate biomarkers for pancreatic adenocarcinoma based on TCGA cohort | Aging