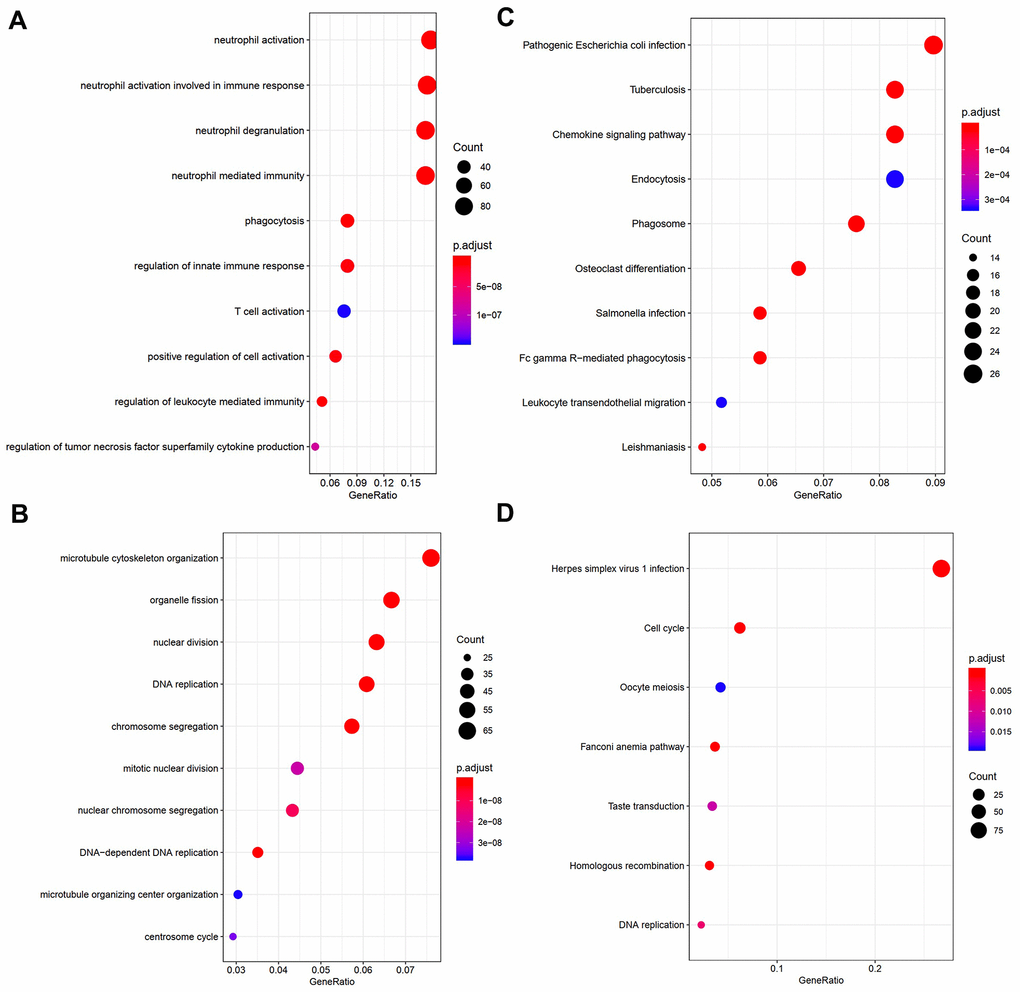
Figure 4.Visualization of part of GO bio-functional analysis results in (A) blue and (C) turquoise module. Visualization of part of KEGG analysis results in (B) blue and (D) turquoise module.
Figure 4 — Identification of hub genes associated with adult acute myeloid leukemia progression through weighted gene co-expression network analysis | Aging