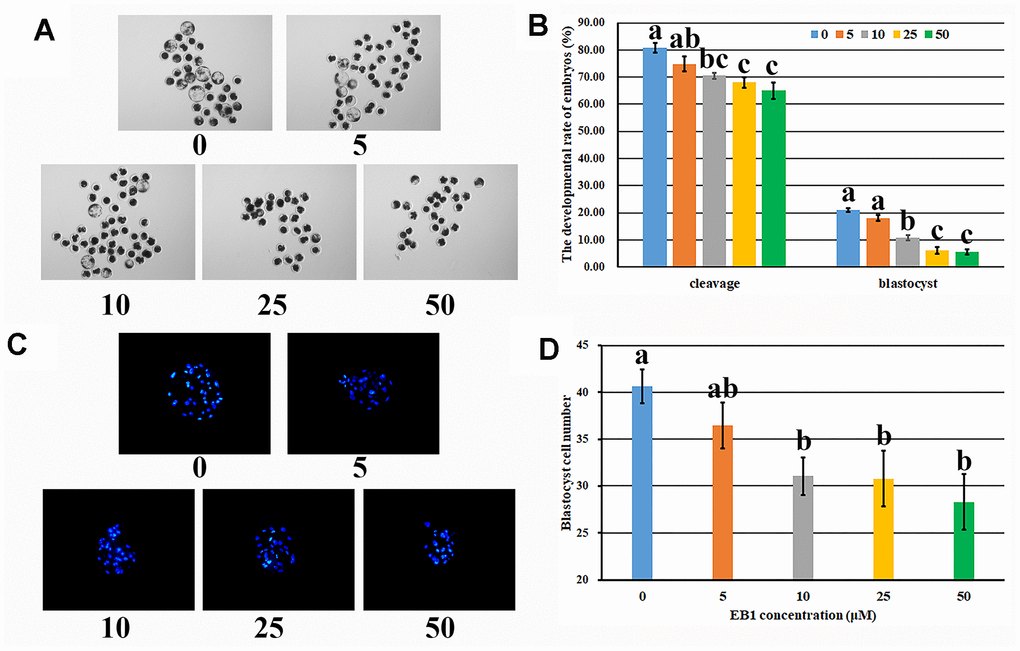
Figure 1.Effect of EB1 with different concentrations on early embryo development. (A) blastocyst (× 40). (B) cleavage rate and blastocyst rate. (C) blastocyst cell number (× 200). (D) average blastocyst cell number. a-cValues for a given group in columns with different superscripts differ significantly (p < 0.05).